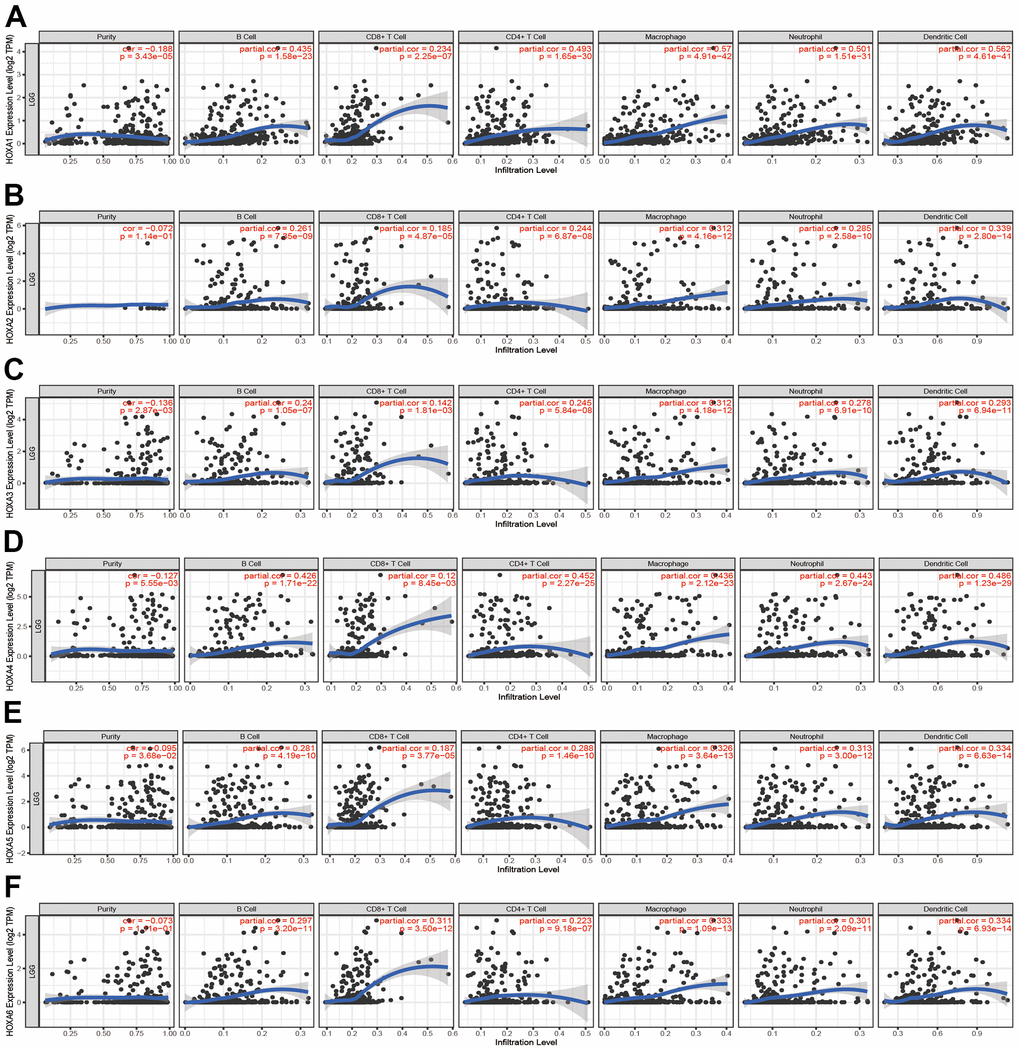
Figure 12.Analysis the correlation between HOXAs expression and diverse immune cell infiltration. (A–F) The correlation between HOXAs expression and diverse immune cell infiltration in LGG examine by TIMER database. *p < 0.05, **p < 0.01, ***p < 0.001.