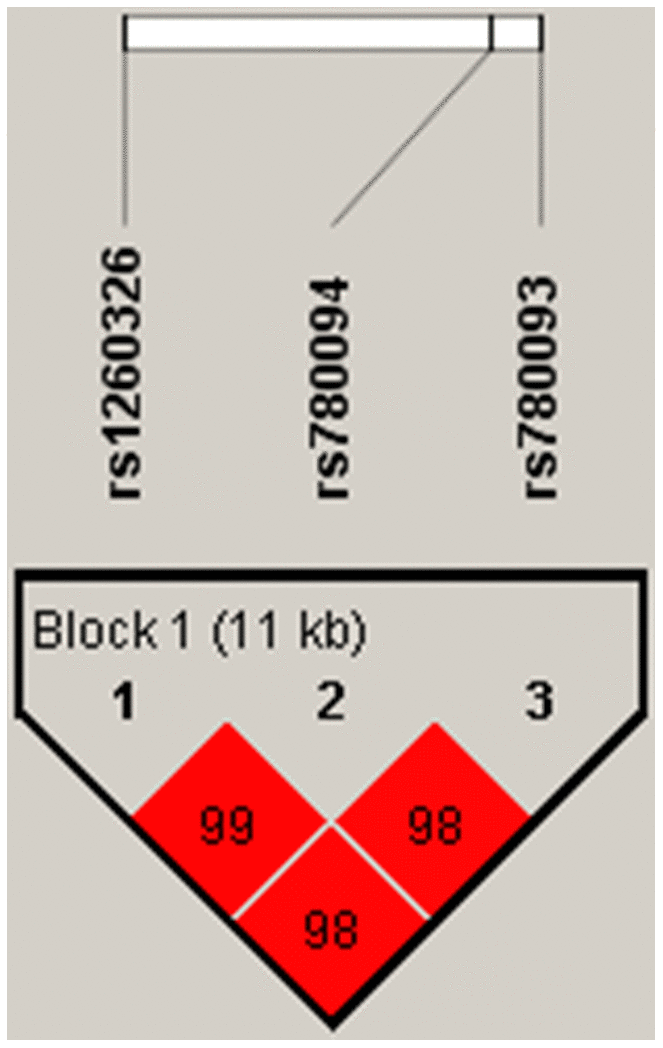
Figure 4.Linkage disequilibrium plot between SNPs. The number in each square is r2*100 between two SNPs. As shown in the picture above rs1260326-rs780094-rs780093 was identified as a strong block with r2>0.8.
Figure 4 — The association between rs1260326 with the risk of NAFLD and the mediation effect of triglyceride on NAFLD in the elderly Chinese Han population | Aging