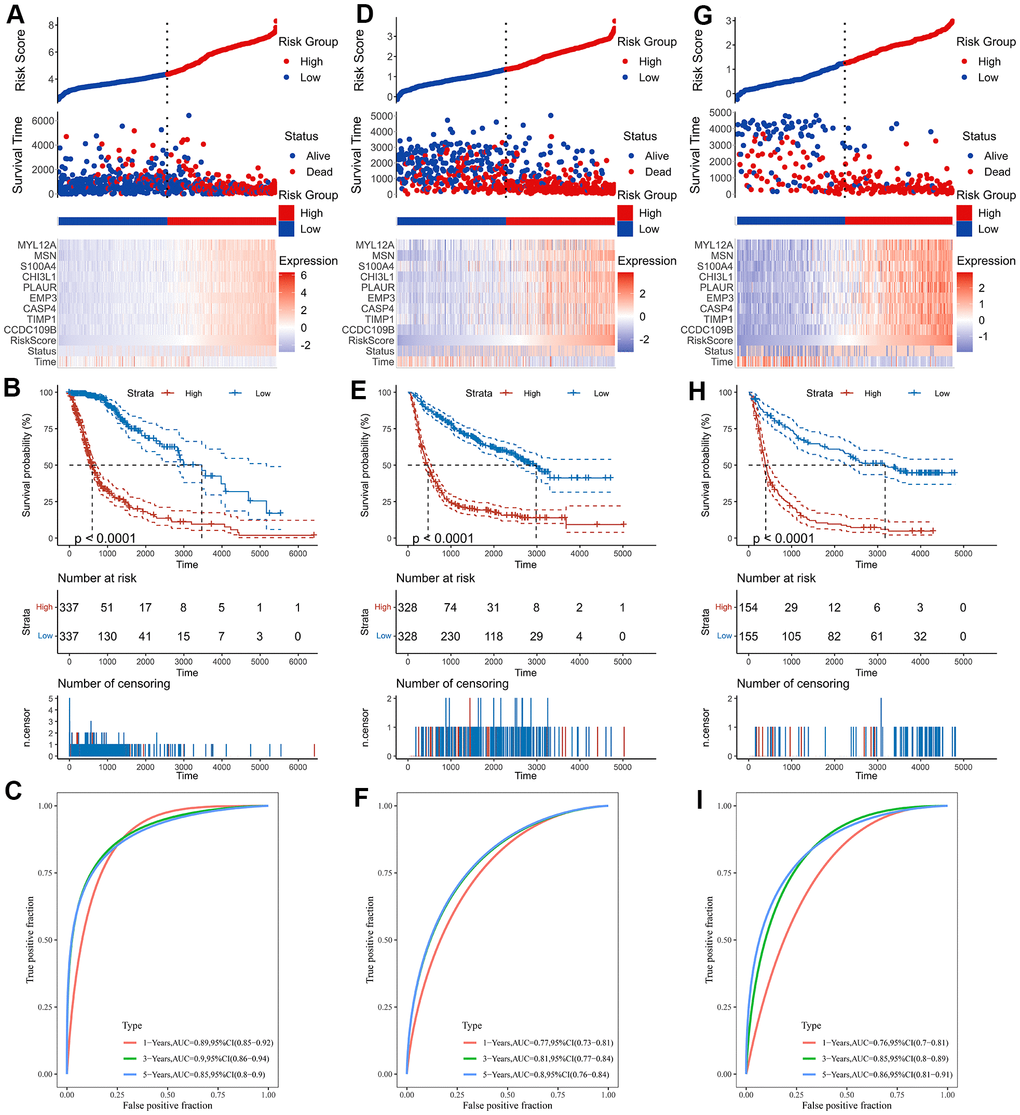
Figure 5.Construction of the risk score signature. (A) Risk signature in the TCGA cohort. (B) Kaplan-Meier analysis according to risk score in the TCGA cohort. (C) The ROC curves depicting the sensitivity and specificity of risk score in predicting the 1-, 3- and 5-year survival in the TCGA cohort. (D) Risk signature in the CGGA mRNAseq-693 cohort. (E) Kaplan-Meier analysis according to risk score in the CGGA mRNAseq-693 cohort. (F) The ROC curves depicting the sensitivity and specificity of risk score in predicting the 1-, 3- and 5-year survival in the CGGA mRNAseq-693 cohort. (G) Risk signature in the CGGA mRNAseq-325 cohort. (H) Kaplan-Meier analysis according to risk score in the CGGA mRNAseq-325 cohort. (I) The ROC curves depicting the sensitivity and specificity of risk score in predicting the 1-, 3- and 5-year survival in the CGGA mRNAseq-325 cohort.