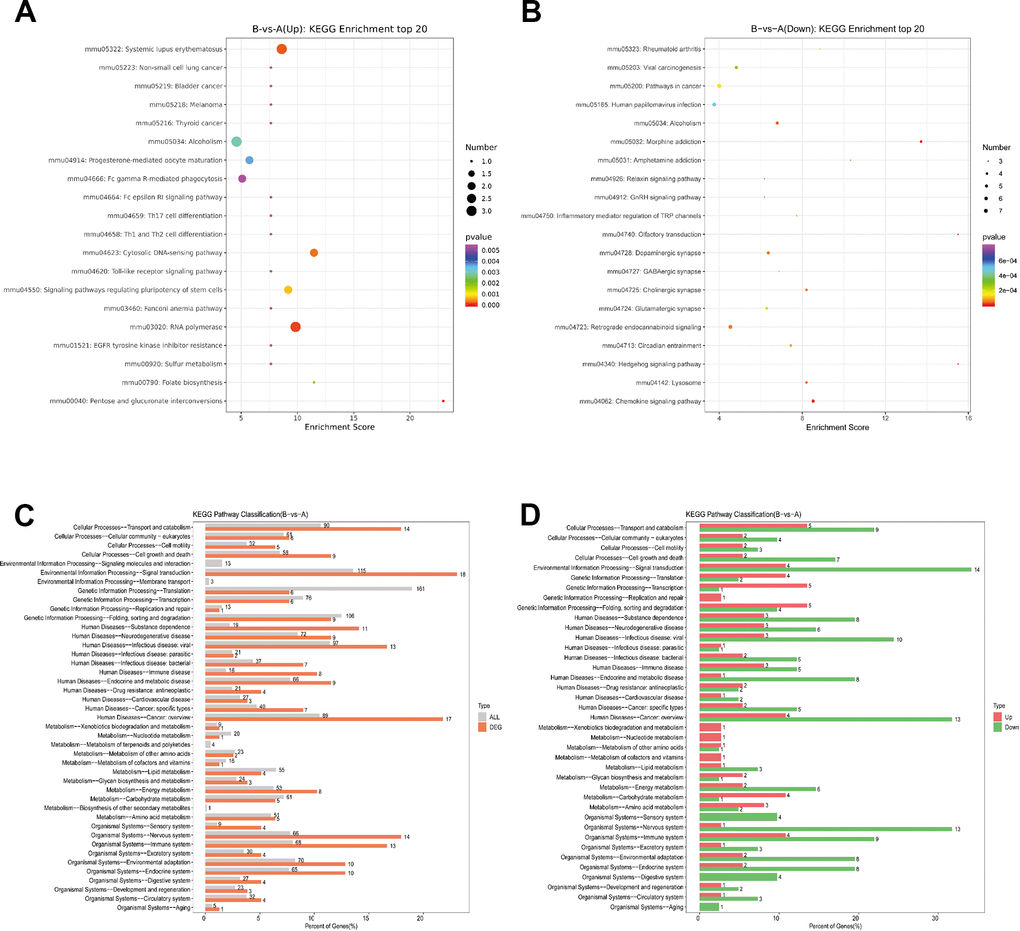
Figure 4.KEGG pathway analysis of DEPs. (A) Bubble Diagram of KEGG enrichment top20 upregulate. (B) Bubble Diagram of KEGG enrichment top20 downregulate. (C) Differentially expressed proteins / genes and all proteins / genes KEGG level2 horizontal distribution comparison chart. (D) Upregulate proteins / genes and downregulate proteins / genes KEGG level2 horizontal distribution comparison chart.