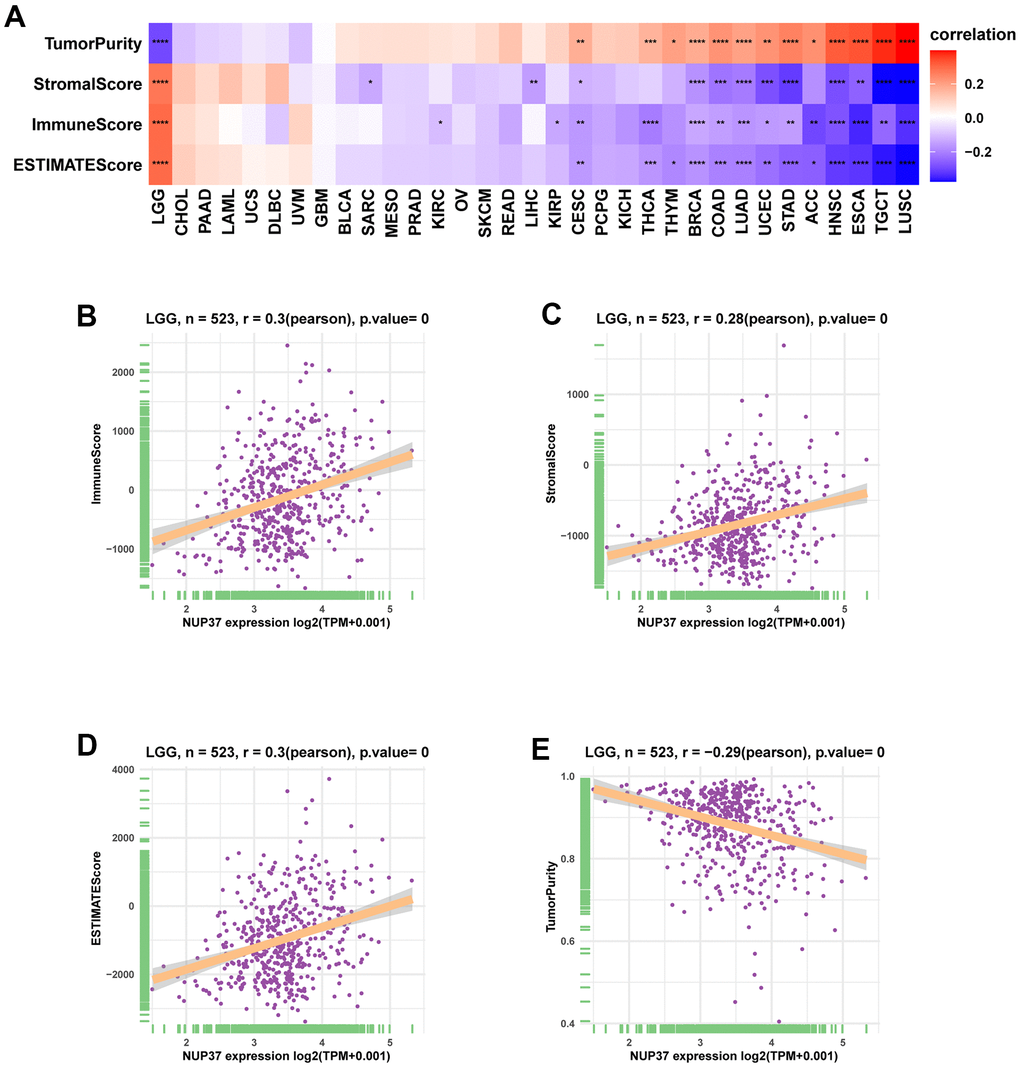
Figure 8.Tumor microenvironment analysis of NUP37. (A) Heatmap represents the correlation between NUP37 expression and TME scores in pan-cancer. (B–E) The correlation between NUP37 expression and immune score (B), stromal score (C), ESTIMATE score (D), and tumor purity score (E) in LGG. *P < 0.05, **P < 0.01, ***P < 0.001, ****P < 0.0001.