Submit an Article
Navigate
Home
Editorial Board
Editorial Policies
Current Volume
Archive
Scientific Integrity
Publication Ethics Statements
Interviews with Outstanding Authors
Newsroom
Sponsored Conferences
Podcast
Contact
Special Collections
Submit an Article
Online ISSN: 1945-4589
Research Paper
|
Volume 14, Issue 2
|
pp. 1033–1047
Pan-cancer analysis reveals NUP37 as a prognostic biomarker correlated with the immunosuppressive microenvironment in glioma
Back to article
Figure 12
(12 of 12)
−
100%
+
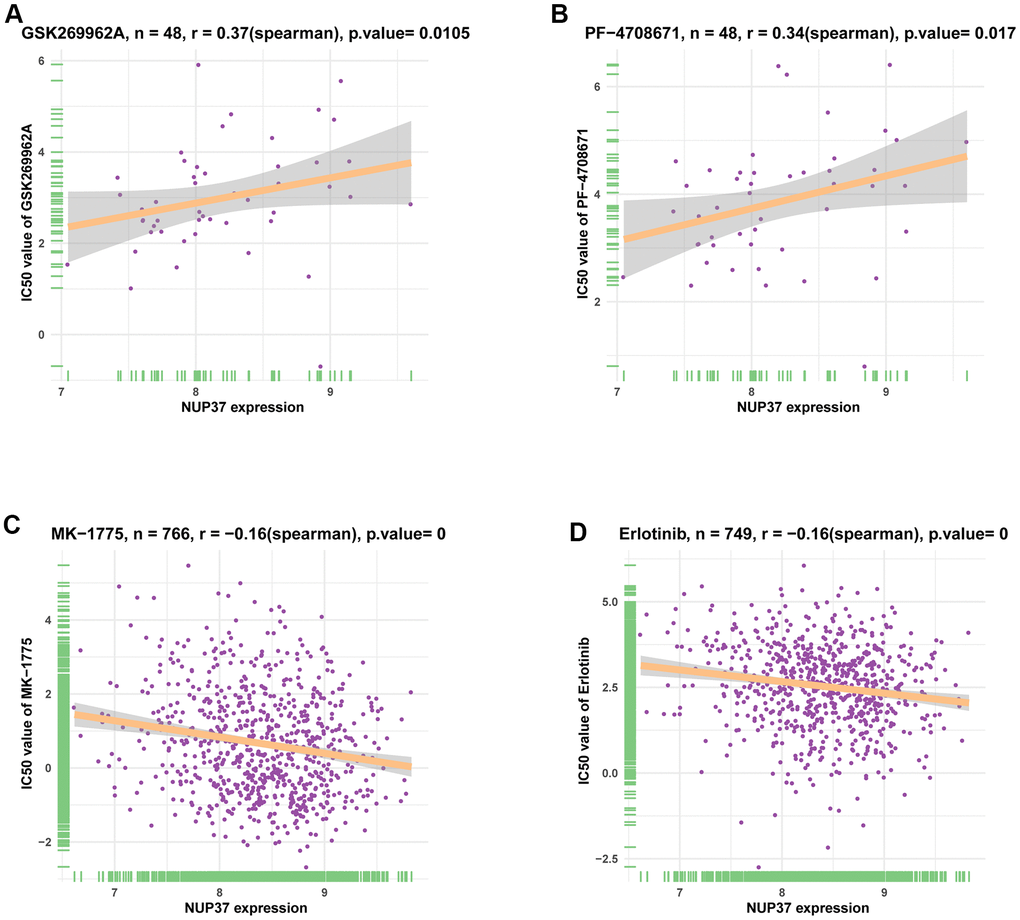
Figure 12.
The correlation between NUP37 expression and IC50 values of anti-cancer drugs.
(
A
–
D
) The correlation between NUP37 expression and IC50 values of indicated anti-cancer drugs.