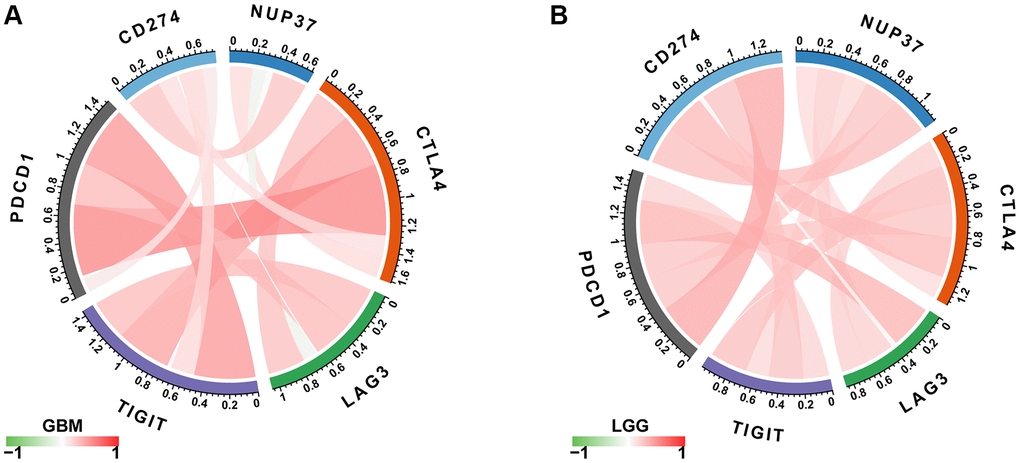
Figure 10.Correlation between immune checkpoints. (A) The correlation between NUP37 expression and immune checkpoints in GBM. (B) The correlation between NUP37 expression and immune checkpoints in LGG. Red lines represent positive correlation, green lines represent negative correlation, and the darker the color, the stronger the correlation.