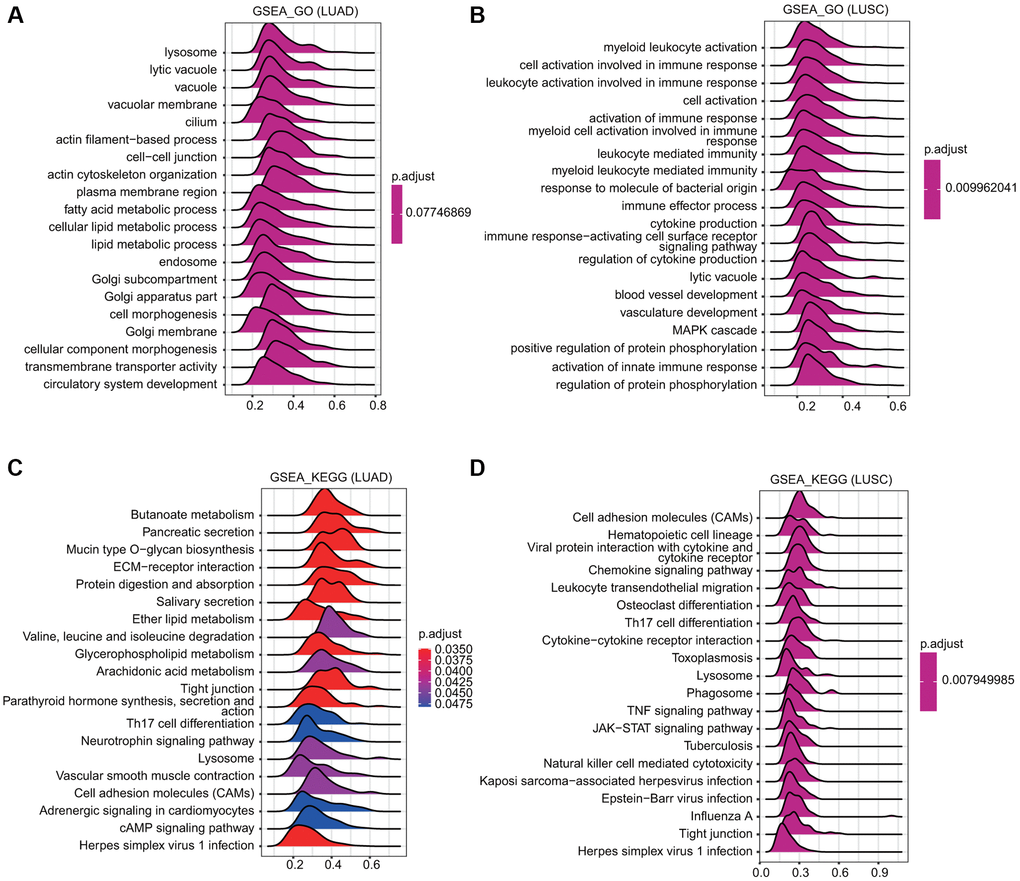
Figure 7.Merged enrichment plots obtained by GSEA. (A, B) Merged plots indicating the signaling pathways associated with TMPRSS2 expression according to GO analyses in LUAD and LUSC. (C, D) Merged plots indicating the signaling pathways associated with TMPRSS2 expression according to KEGG analyses in LUAD and LUSC.