Submit an Article
Navigate
Home
Editorial Board
Editorial Policies
Current Volume
Archive
Scientific Integrity
Publication Ethics Statements
Interviews with Outstanding Authors
Newsroom
Sponsored Conferences
Podcast
Contact
Special Collections
Submit an Article
Online ISSN: 1945-4589
Research Paper
|
Volume 13, Issue 24
|
pp. 26095–26117
Knockdown hsa_circ_0063526 inhibits endometriosis progression via regulating the miR-141-5p / EMT axis and downregulating estrogen receptors
Back to article
Figure 10
(10 of 13)
−
100%
+
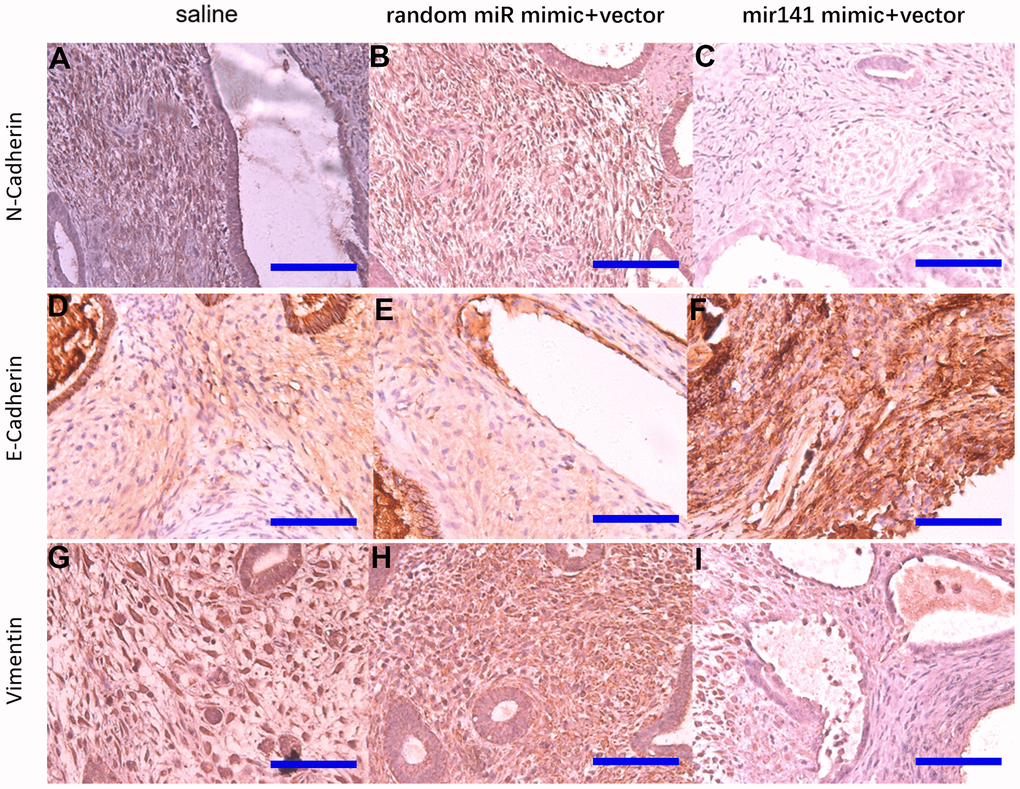
Figure 10.
Representative images of N-cadherin, E-cadherin, and Vimentin protein levels detected by immunohistochemistry.
N-cadherin protein (
A
–
C
), E-cadherin protein (
D
–
F
), Vimentin protein (
G
–
I
) (bar:50μm).