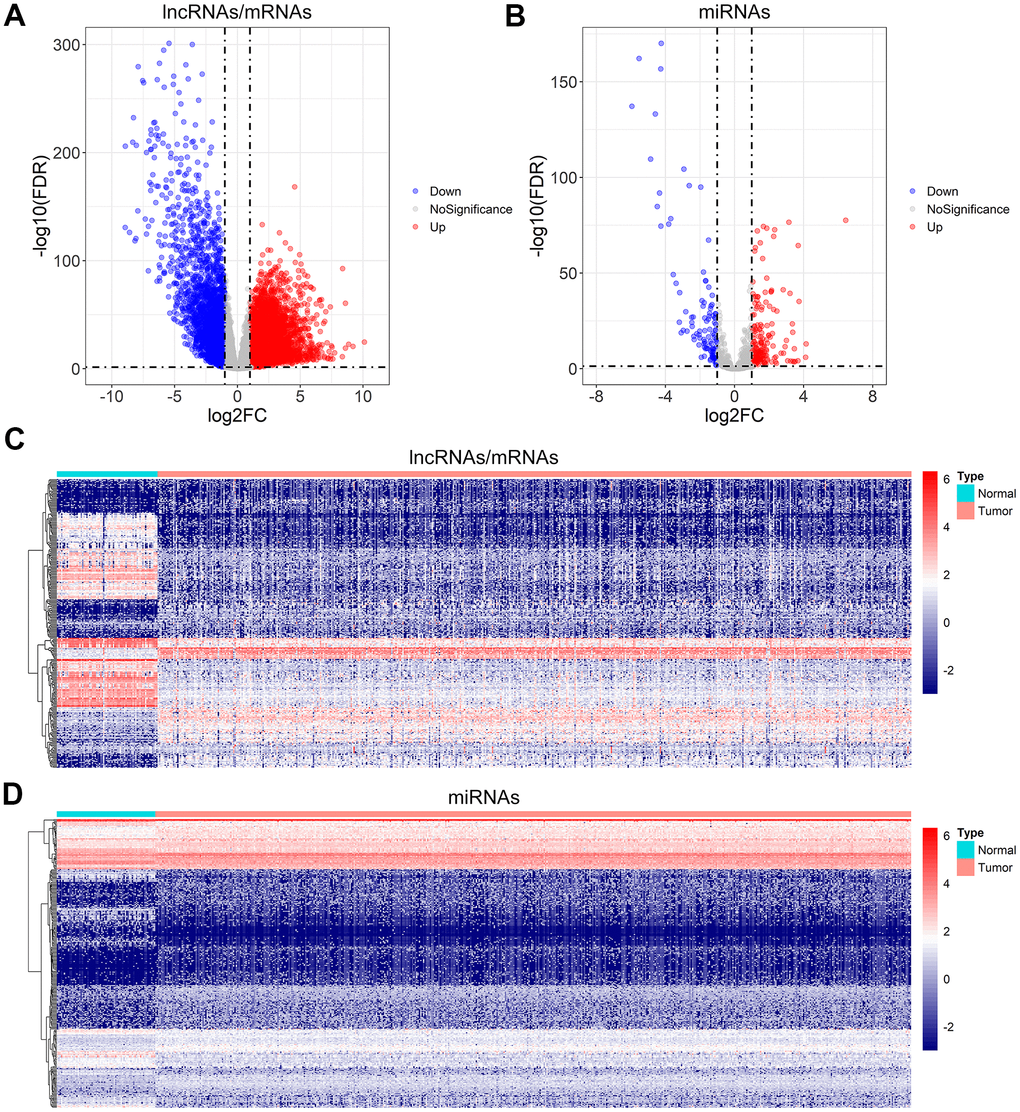
Figure 1.Differential gene expression analysis for ccRCC. (A, B) Volcano plot of the differentially expressed lncRNAs/mRNAs, and miRNAs. (C, D) The heatmap of the top 300 differentially expressed lncRNAs/mRNAs, and miRNAs.
Figure 1 — Identification of a competing endogenous RNA network related to immune signature in clear cell renal cell carcinoma | Aging