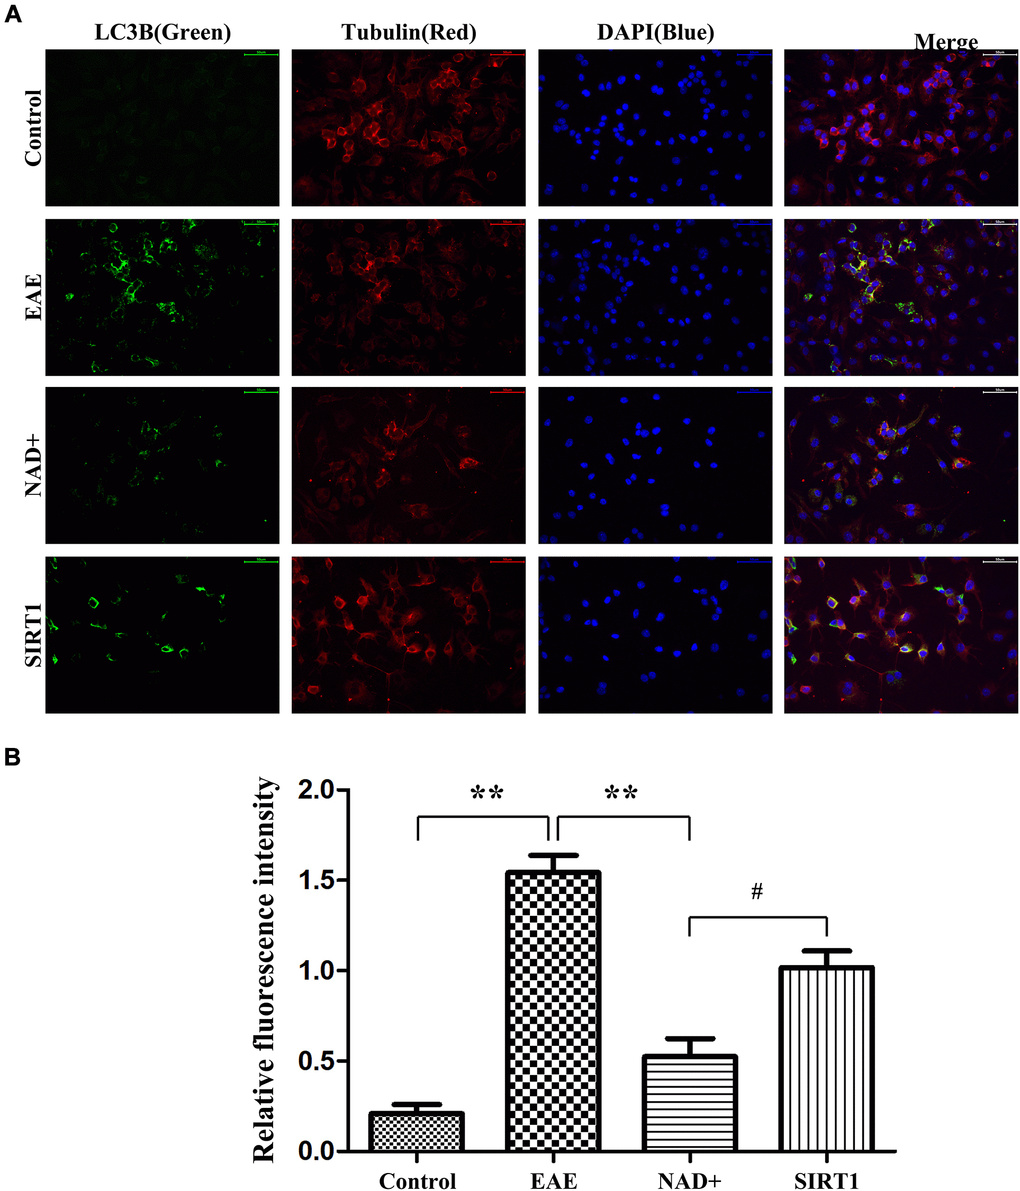
Figure 6.Autophagy degree of LC-3A/B at the cellular level. (A) Under fluorescence microscope, immunofluorescence staining was used to present the expression of LC-3A/B at the cellular level. (B) Column diagram manifesting the relative fluorescence intensity in the different group at the cellular level.