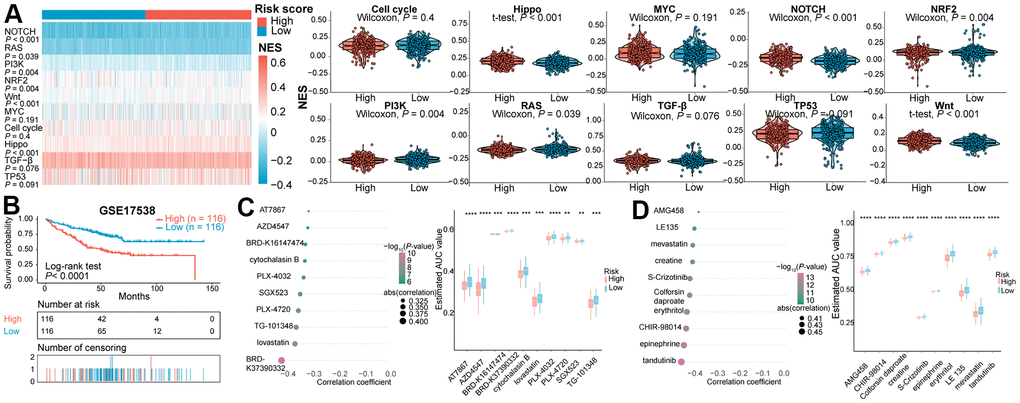
Figure 3.(A) Heatmap and violin plots of the NES of 10 oncogenic pathways between two subtypes in the TCGA cohort. (B) Kaplan-Meier survival curve of the high- and low- risk subgroups in GSE17538 dataset for identifying potential therapeutic agents. (C) Spearman’s correlation analysis and differential drug response analysis of 10 CTRP-derived compounds. (D) Spearman’s correlation analysis and differential drug response analysis of 10 PRISM-derived compounds. NES, normalized enrichment score.