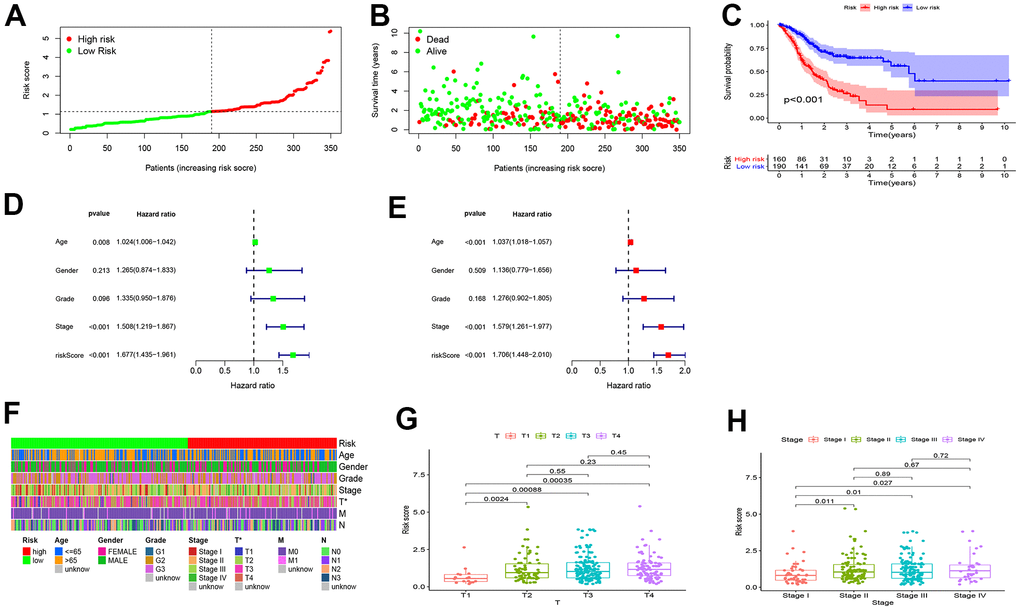
Figure 4.Internal validation of the risk model for GC prognosis. (A, B) The RiskScore and overall survival rate of each patient in the low- and high-risk group. (C) High-risk patients had shorter overall survival than low-risk patients. (D) Univariate and (E) multivariate Cox risk ratio analysis revealed that the risk model could predict GC prognosis independently. (F–H) The Wilcoxon signed-rank test showed that patients with high RiskScore often yielded late clinical stages, and the results were visualized in heatmaps and boxplots.