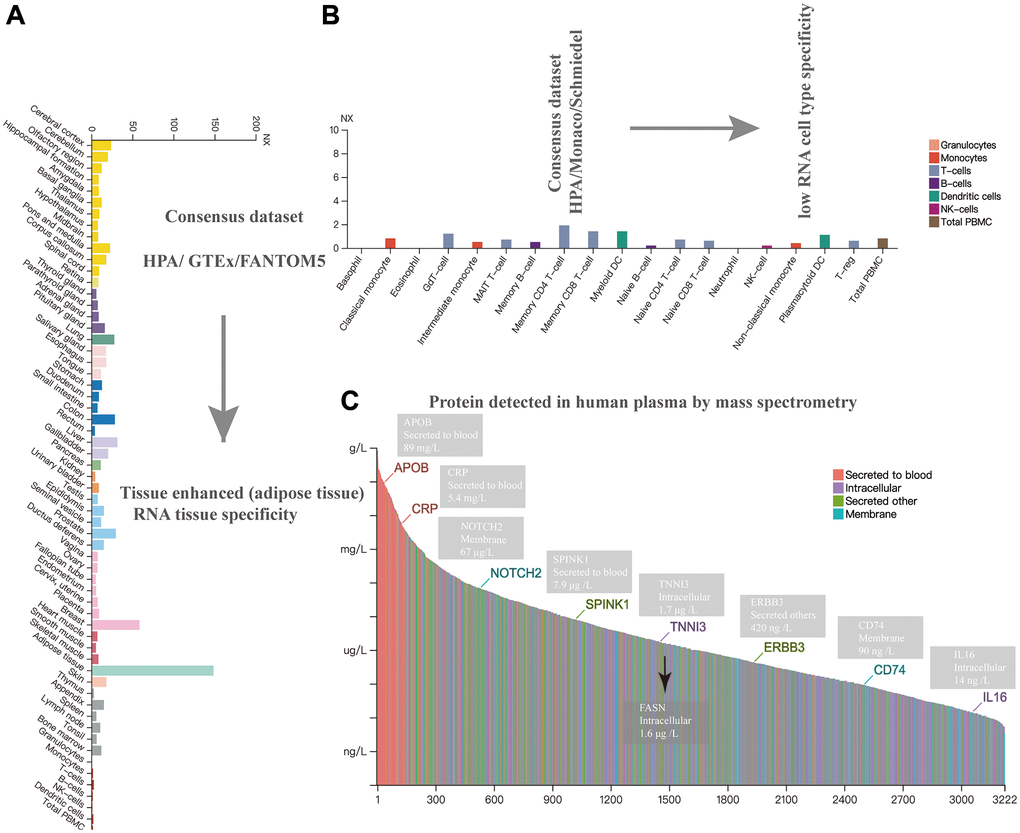
Figure 2.Expression analysis of FASN in different cells, tissues, and plasma. Expression of the FASN gene in different tissues (A), blood cells (B), and plasma (C) based on mass spectrometry.
Figure 2 — Landscape of the oncogenic role of fatty acid synthase in human tumors | Aging