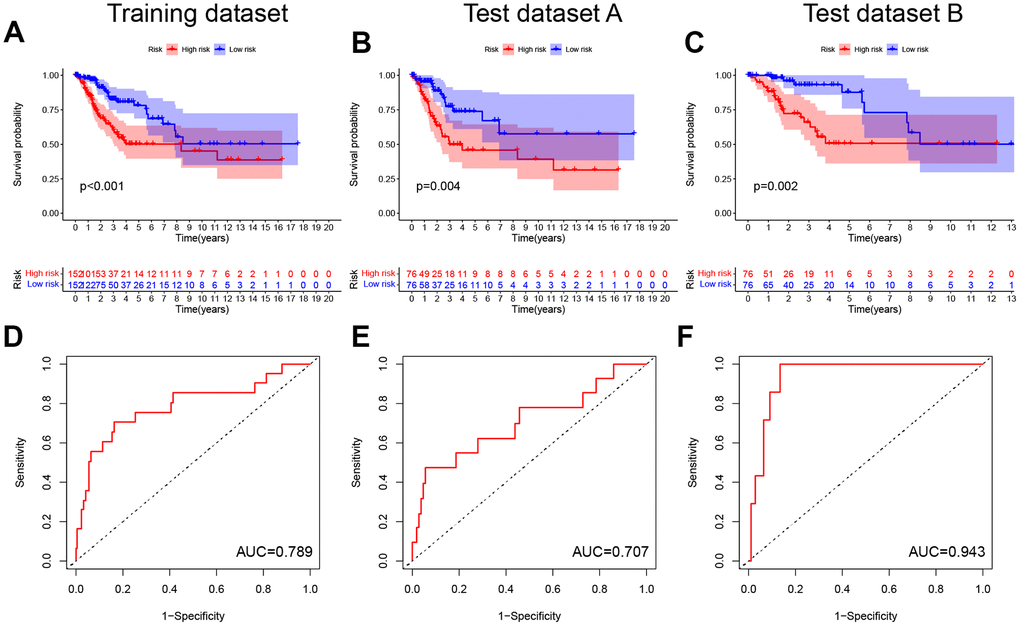
Figure 3.Construction and validation of the pyroptosis-related signature. (A–C) Kaplan-Meier curves showed lower overall survival rates in the high-risk group than in the low-risk group in the training dataset, test dataset A and test dataset B (P < 0.05). (D–F) The predicted ROC curves for the training dataset, test dataset A and test dataset B were 0.789, 0.707, and 0.943 respectively.