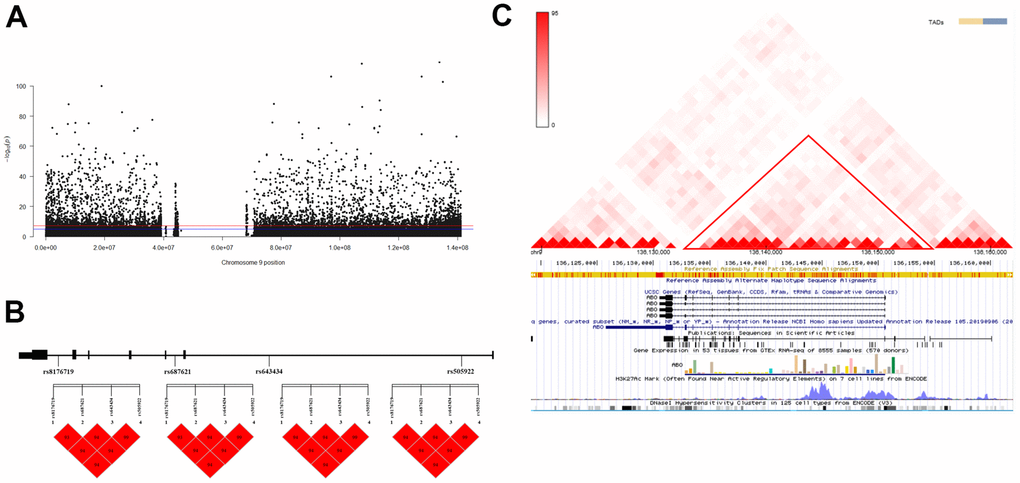
Figure 1.Association analysis identified ABO as the longevity-associated gene. (A) Manhattan plot of Genome-Wide Association Studies (GWAS) on chromosome 9; (B) Linkage Disequilibrium (LD) analysis of the four variants. a: LD map of centenarians; b: LD map of nonagenarians; c: LD map of longevity; d: LD map of young controls. (C) Interaction analysis of the four variants in the three-dimensional genome. The red triangle box shows the Topologically Associating Domains (TAD) region on the ABO gene.