Submit an Article
Navigate
Home
Editorial Board
Editorial Policies
Current Volume
Archive
Scientific Integrity
Publication Ethics Statements
Interviews with Outstanding Authors
Newsroom
Sponsored Conferences
Podcast
Contact
Special Collections
Submit an Article
Online ISSN: 1945-4589
Research Paper
|
Volume 13, Issue 21
|
pp. 24171–24191
LncRNA OTUD6B-AS1 promotes paclitaxel resistance in triple negative breast cancer by regulation of miR-26a-5p/MTDH pathway-mediated autophagy and genomic instability
Back to article
Figure 3
(3 of 7)
−
100%
+
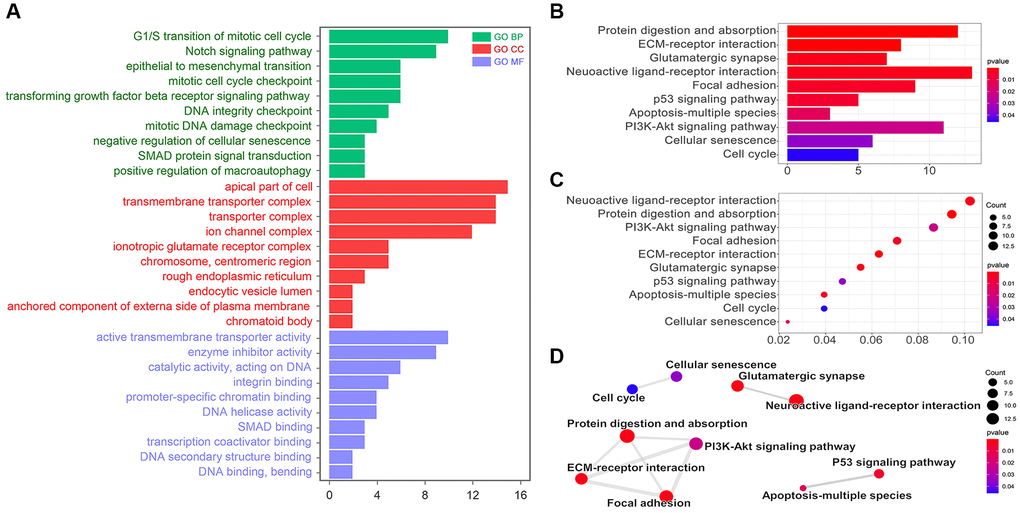
Figure 3.
KEGG and GO analysis.
(
A
) Go pathway (Biological Process, BP; Cellular Component, CC; Molecular Function, MF) analysis by R. KEGG analysis results showed by (
B
) bar diagram, (
C
) bubble diagram, and (
D
) interaction diagram.