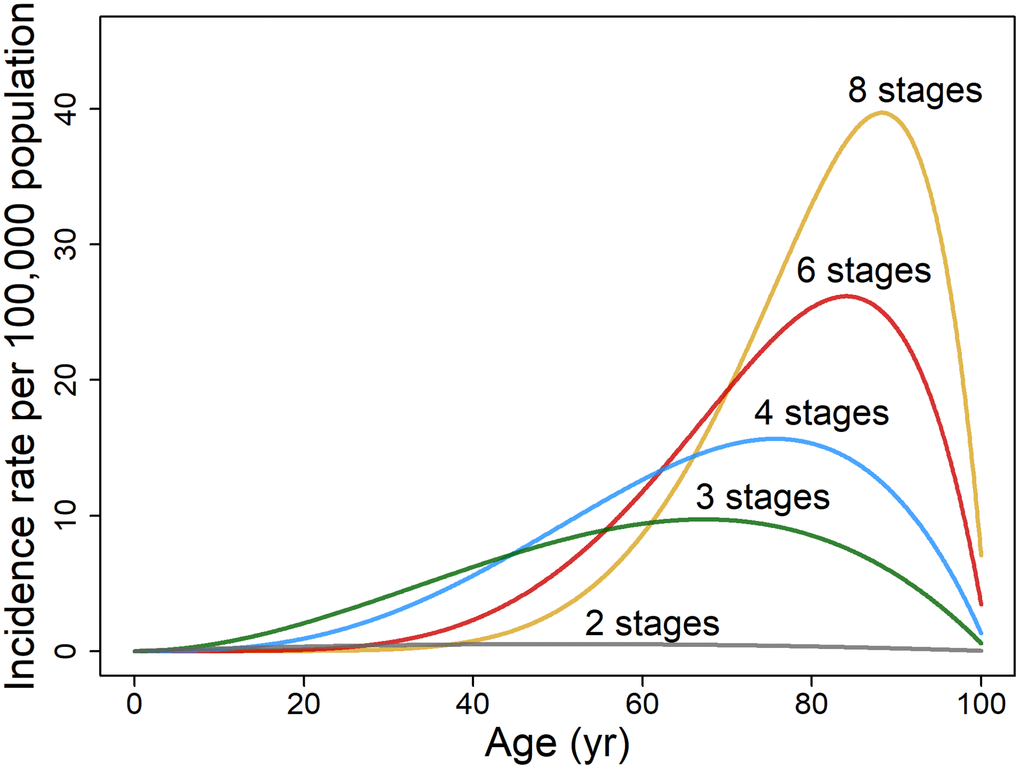
Figure 3.Illustrative plots of age-specific rate of cancer incidence per 100,000 population based on two variables, age t and cancer stages k. The age-dependent incidence rate of hypothetical cancers is modeled on non-reproductive cancers for both sexes pooled (n = 21) as described by Equation 6 (assuming b = 0.0099, c = 0.0046 and d = 0.0087).
Figure 3 — Profound synchrony of age-specific incidence rates and tumor suppression for different cancer types as revealed by the multistage-senescence model of carcinogenesis | Aging