Submit an Article
Navigate
Home
Editorial Board
Editorial Policies
Current Volume
Archive
Scientific Integrity
Publication Ethics Statements
Interviews with Outstanding Authors
Newsroom
Sponsored Conferences
Podcast
Contact
Special Collections
Submit an Article
Online ISSN: 1945-4589
Research Paper
|
Volume 13, Issue 20
|
pp. 23527–23544
NEOage clocks - epigenetic clocks to estimate post-menstrual and postnatal age in preterm infants
Back to article
Figure 5
(5 of 6)
−
100%
+
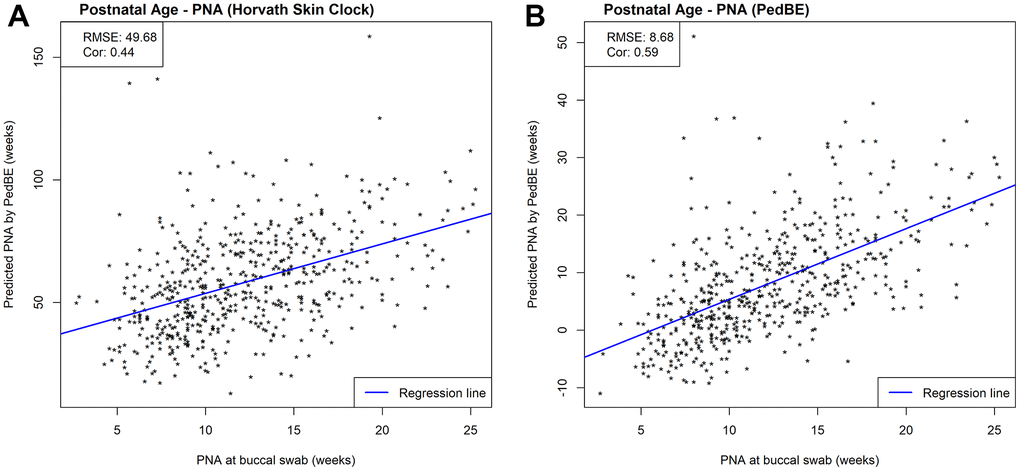
Figure 5.
Scatterplots of PNA estimated by (
A
) Horvath’s skin-blood clock and (
B
) PedBE and measured PNA within NOVI. Prediction performances are evaluated by RMSE and correlations between estimated and measured PNA.