Submit an Article
Navigate
Home
Editorial Board
Editorial Policies
Current Volume
Archive
Scientific Integrity
Publication Ethics Statements
Interviews with Outstanding Authors
Newsroom
Sponsored Conferences
Podcast
Contact
Special Collections
Submit an Article
Online ISSN: 1945-4589
Research Paper
|
Volume 13, Issue 19
|
pp. 23348–23360
Differential moderation effects of ApoE and 5-HTTLPR genotypes on social vulnerability in predicting mortality among community-dwelling middle-aged and older adults: a nationwide population-based study
Back to article
Figure 4
(4 of 4)
−
100%
+
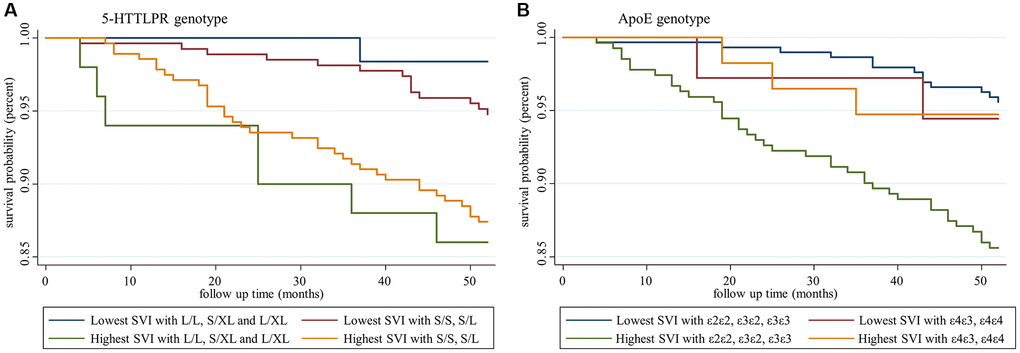
Figure 4.
Survival analysis of participants with different social vulnerability index and genotype statuses.
(
A
) Social vulnerability index and 5-HTTLPR genotypes, and (
B
) social vulnerability index and ApoE genotypes.