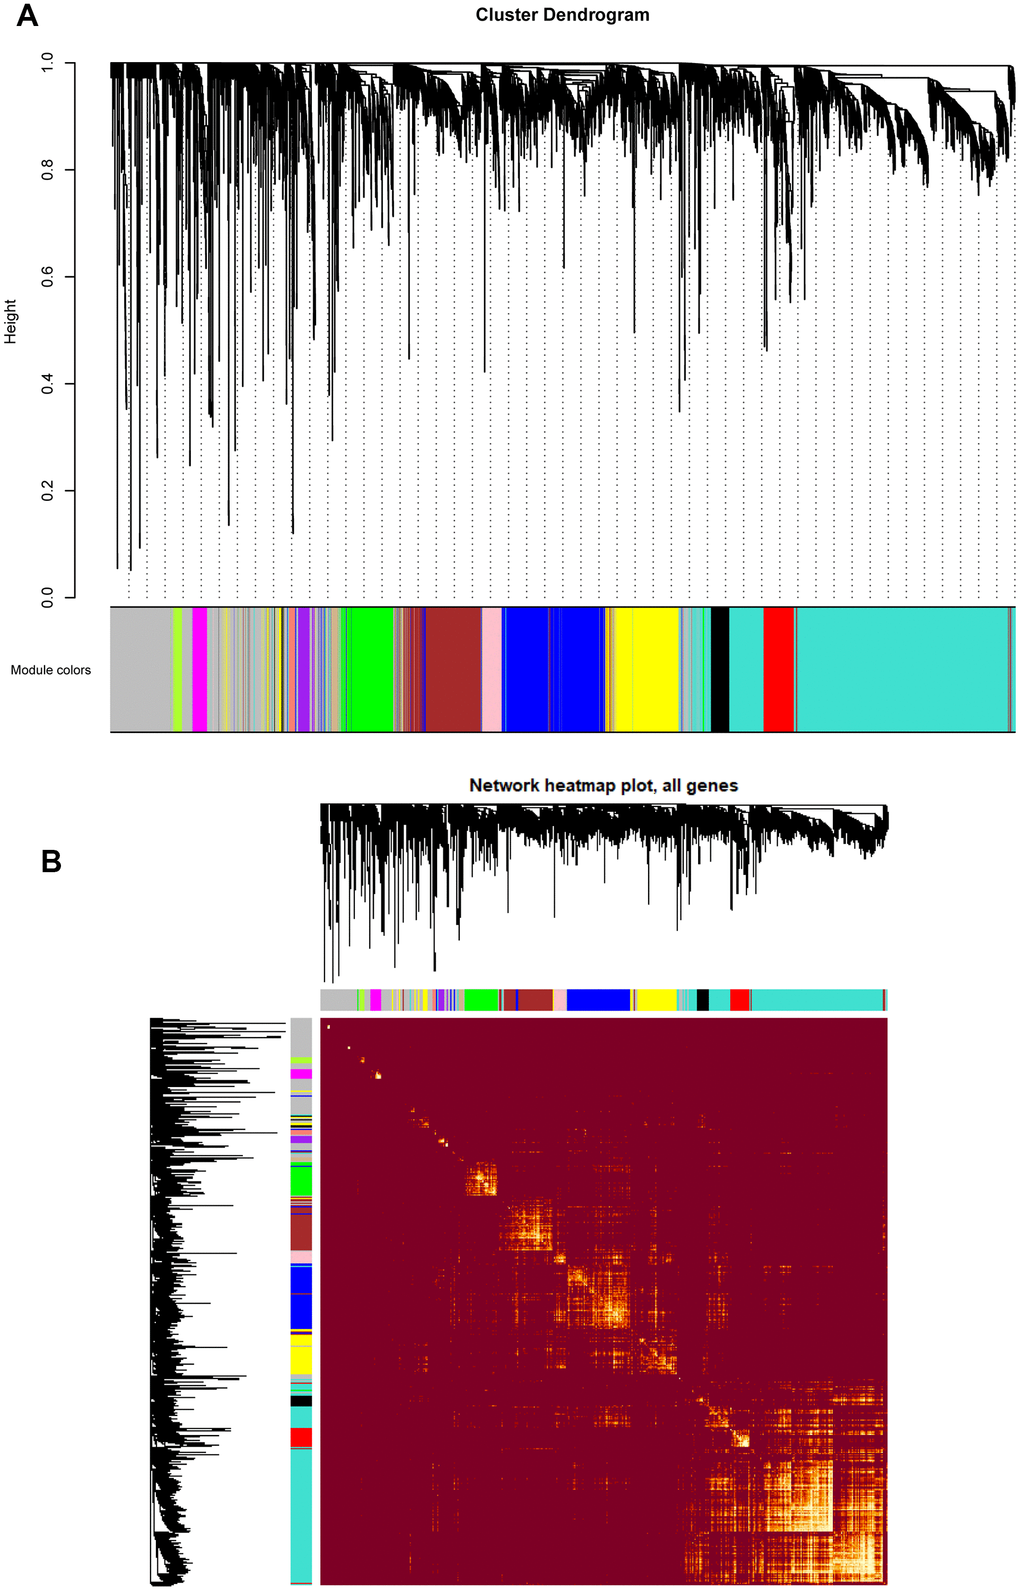
Figure 3.(A) Cluster dendrogram of all genes enriched based on the dissimilarity measure and the assignment modules. Highly interconnected groups of genes were clustered. Every color below represented one co-expression module, totally 14 distinct modules were identified with the hierarchical clustering tree analysis. (B) Topological overlap heatmap of the gene co-expression network. Each row and column represented a gene. Light color indicated high topological overlap and dark color represented low topological overlap. Different colors on x and y axis indicated different modules. The dendrogram suggested that the clustering of these genes was based on the similarity of their gene expression levels.