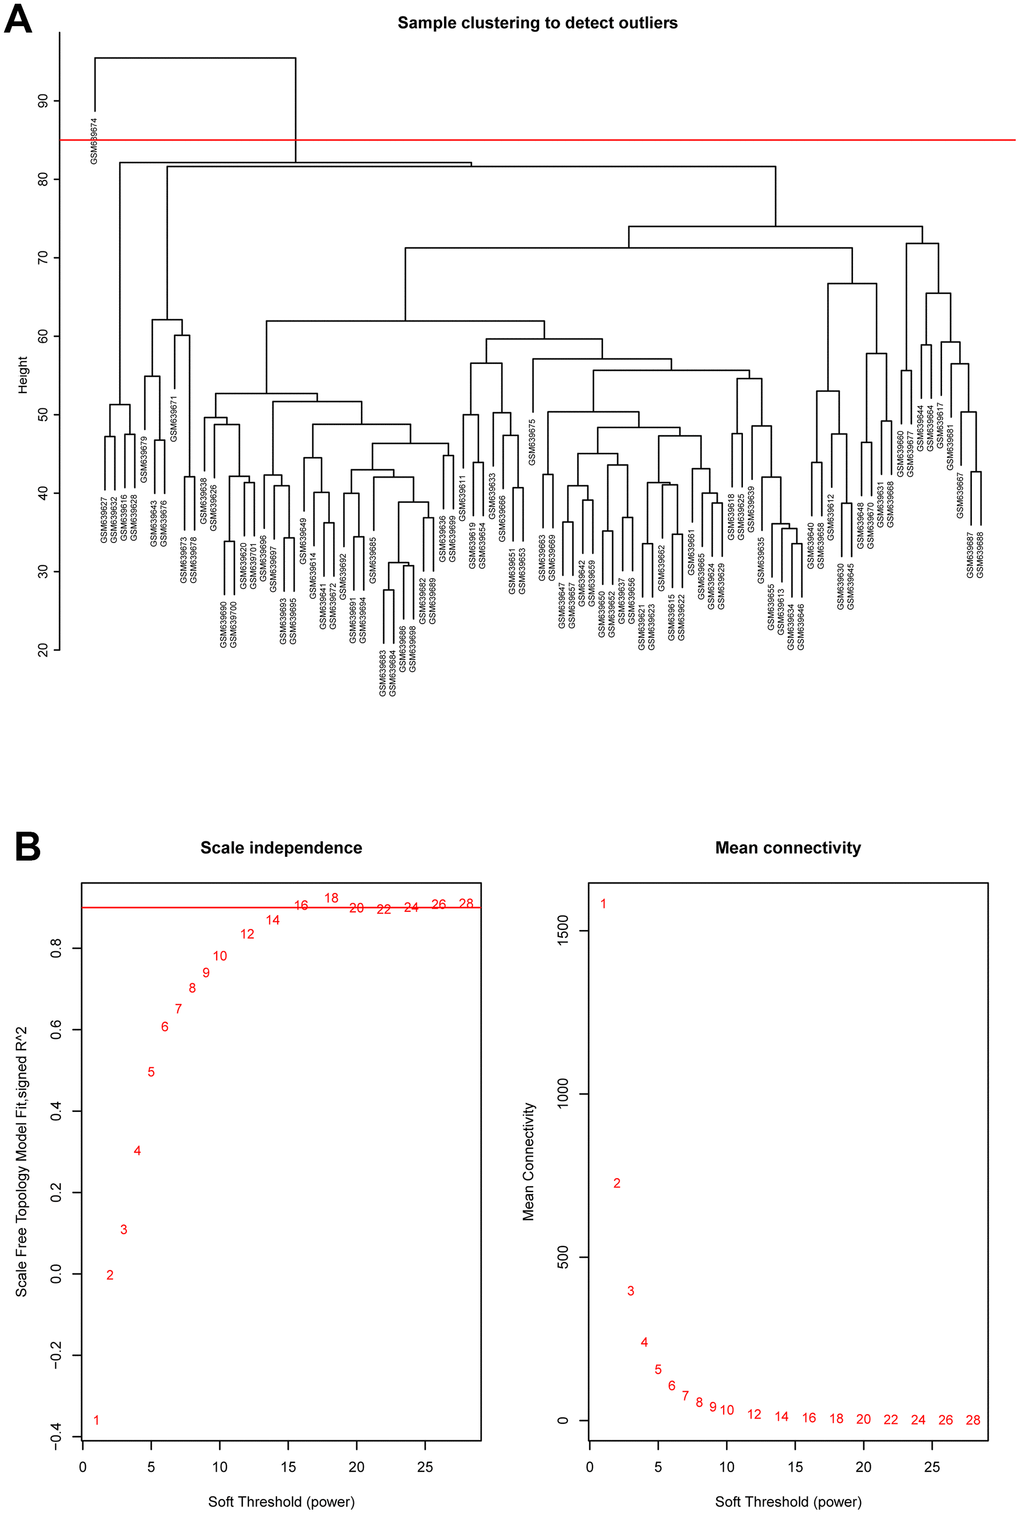
Figure 2.(A) Cluster dendrogram of samples in GSE26049 to detect outliers. The dendrogram branches represented the clustered samples. (B) Selection of soft threshold power value through WGCNA analysis. The left panel showed the scale-free model fit index (y axis) as function of soft thresholding power value (x axis). Red line represented the y-axis value. Right panel displayed the mean connectivity (y axis) as a function of soft thresholding powers (x axis).