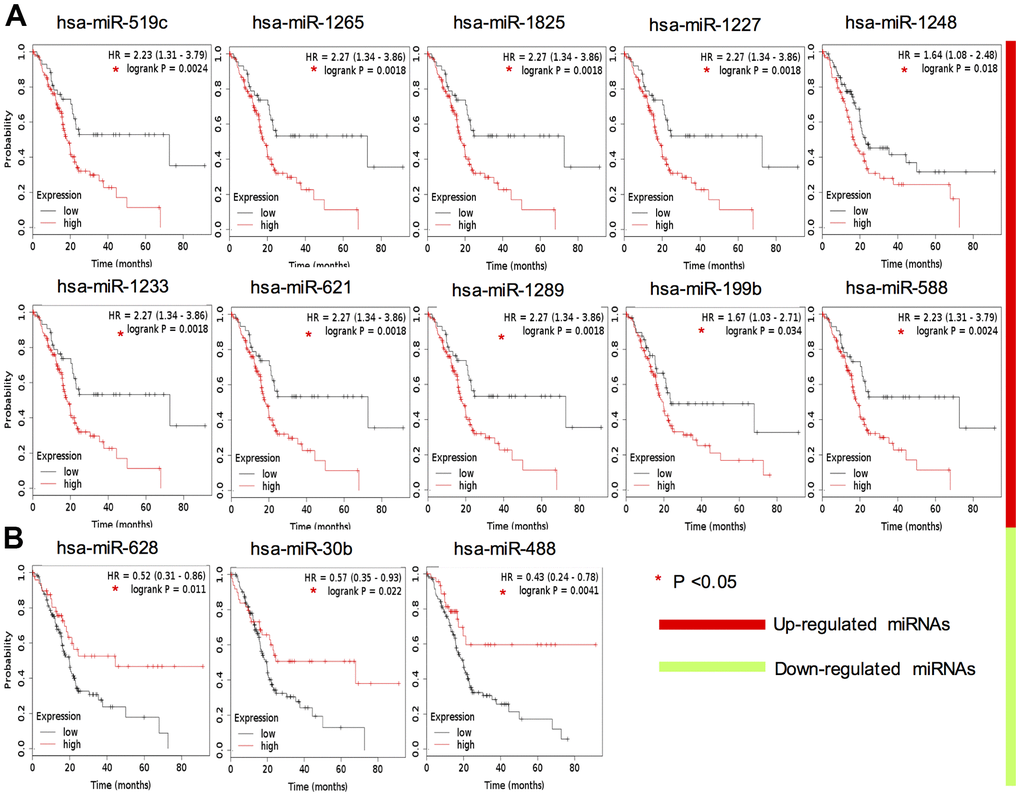
Figure 3.Survival analysis of 13 key DEMs expression in TCGA PAAD cohort. Red color indicates upregulation (A), whereas green color indicates that the miRNA is downregulated (B).
Figure 3 — RUNX2 and LAMC2: promising pancreatic cancer biomarkers identified by an integrative data mining of pancreatic adenocarcinoma tissues | Aging