Submit an Article
Navigate
Home
Editorial Board
Editorial Policies
Current Volume
Archive
Scientific Integrity
Publication Ethics Statements
Interviews with Outstanding Authors
Newsroom
Sponsored Conferences
Podcast
Contact
Special Collections
Submit an Article
Online ISSN: 1945-4589
Research Paper
|
Volume 13, Issue 18
|
pp. 22315–22331
High CTSL2 expression predicts poor prognosis in patients with lung adenocarcinoma
Back to article
Figure 8
(8 of 11)
−
100%
+
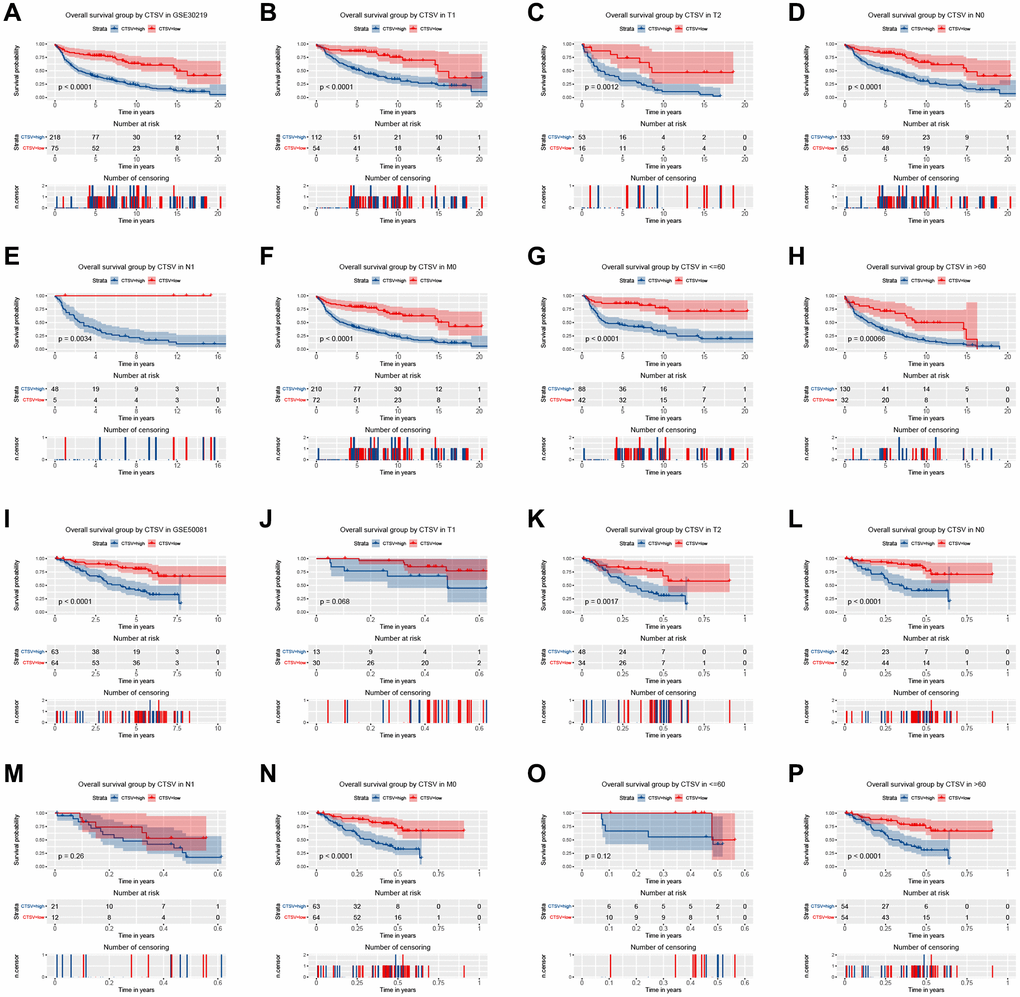
Figure 8.
Kaplan–Meier curve for overall survival in lung adenocarcinoma in the validation datasets GSE30219 (
A
–
H
) and GSE50081 (
I
–
P
).
Figure 8 — High CTSL2 expression predicts poor prognosis in patients with lung adenocarcinoma | Aging