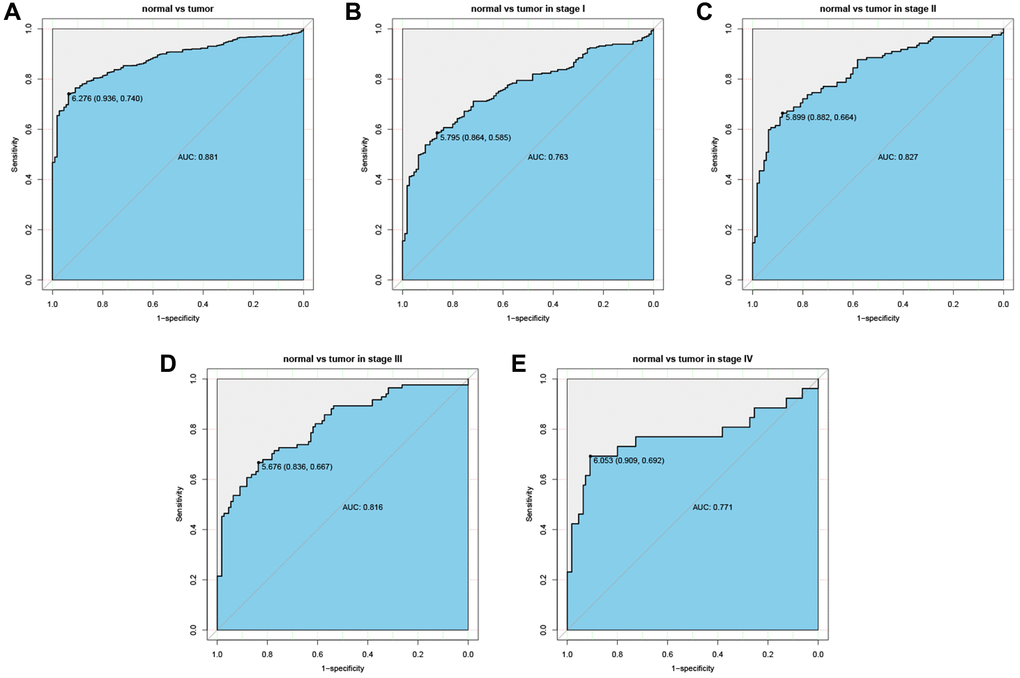
Figure 5.Diagnostic value of CTSL2 expression in lung adenocarcinoma. (A) ROC curve for CTSL2 in normal lung tissue and tumor; (B–E) Subgroup analysis for stage I, II, III, and IV.
Figure 5 — High CTSL2 expression predicts poor prognosis in patients with lung adenocarcinoma | Aging