Submit an Article
Navigate
Home
Editorial Board
Editorial Policies
Current Volume
Archive
Scientific Integrity
Publication Ethics Statements
Interviews with Outstanding Authors
Newsroom
Sponsored Conferences
Podcast
Contact
Special Collections
Submit an Article
Online ISSN: 1945-4589
Research Paper
|
Volume 13, Issue 16
|
pp. 20661–20683
METTL21B is a prognostic biomarker and potential therapeutic target in low-grade gliomas
Back to article
Figure 5
(5 of 9)
−
100%
+
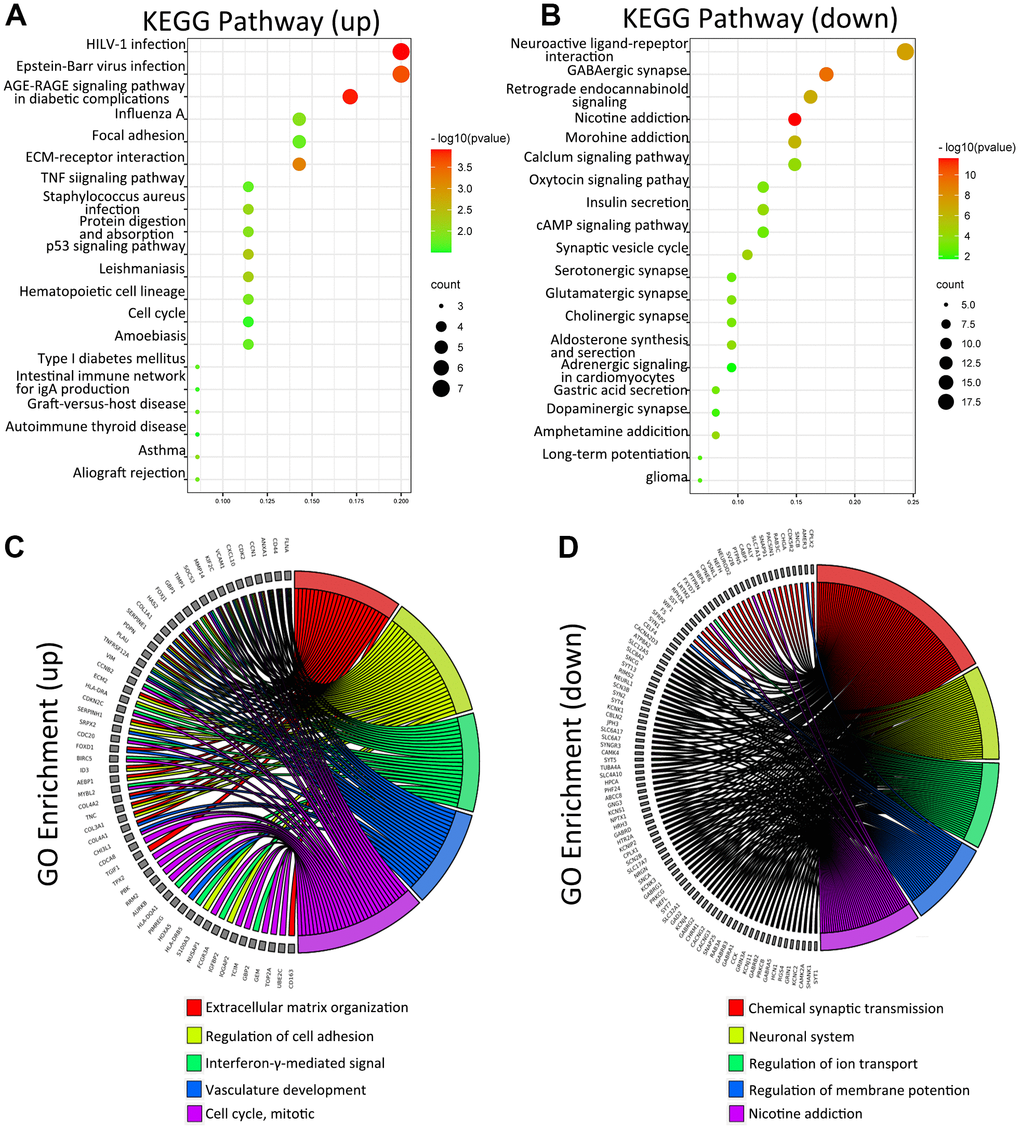
Figure 5.
KEGG and GO analysis of DEGs between low and high METTL21B expression groups.
KEGG analysis of DEGs (
A
,
B
); GO analysis of DEGs (
C
,
D
).