Submit an Article
Navigate
Home
Editorial Board
Editorial Policies
Current Volume
Archive
Scientific Integrity
Publication Ethics Statements
Interviews with Outstanding Authors
Newsroom
Sponsored Conferences
Podcast
Contact
Special Collections
Submit an Article
Online ISSN: 1945-4589
Research Paper
|
Volume 13, Issue 16
|
pp. 20050–20080
Effects of Siberian fir terpenes extract Abisil on antioxidant activity, autophagy, transcriptome and proteome of human fibroblasts
Back to article
Figure 13
(13 of 14)
−
100%
+
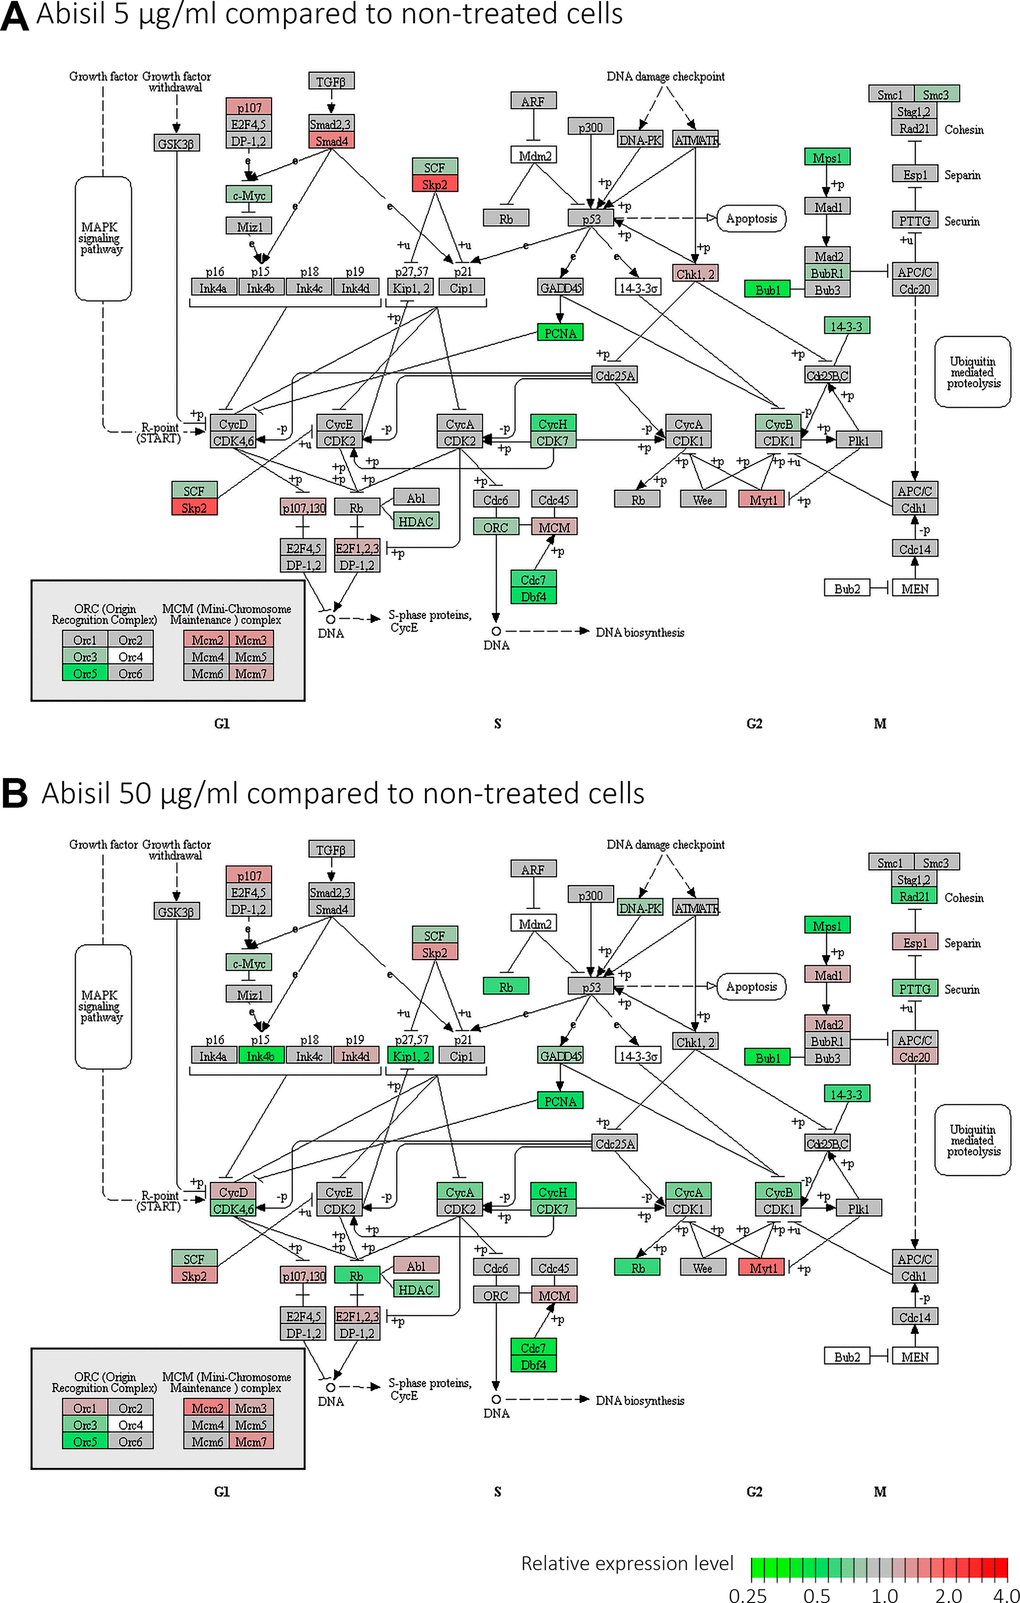
Figure 13.
Diagram illustrating expression changes of genes participating cell cycle signaling pathway (KEGG) after Abisil treatment (MRC5-SV40 cell line):
5 μg/ml (
A
) and 50 μg/ml (
B
). Green – downregulation, red – upregulation.