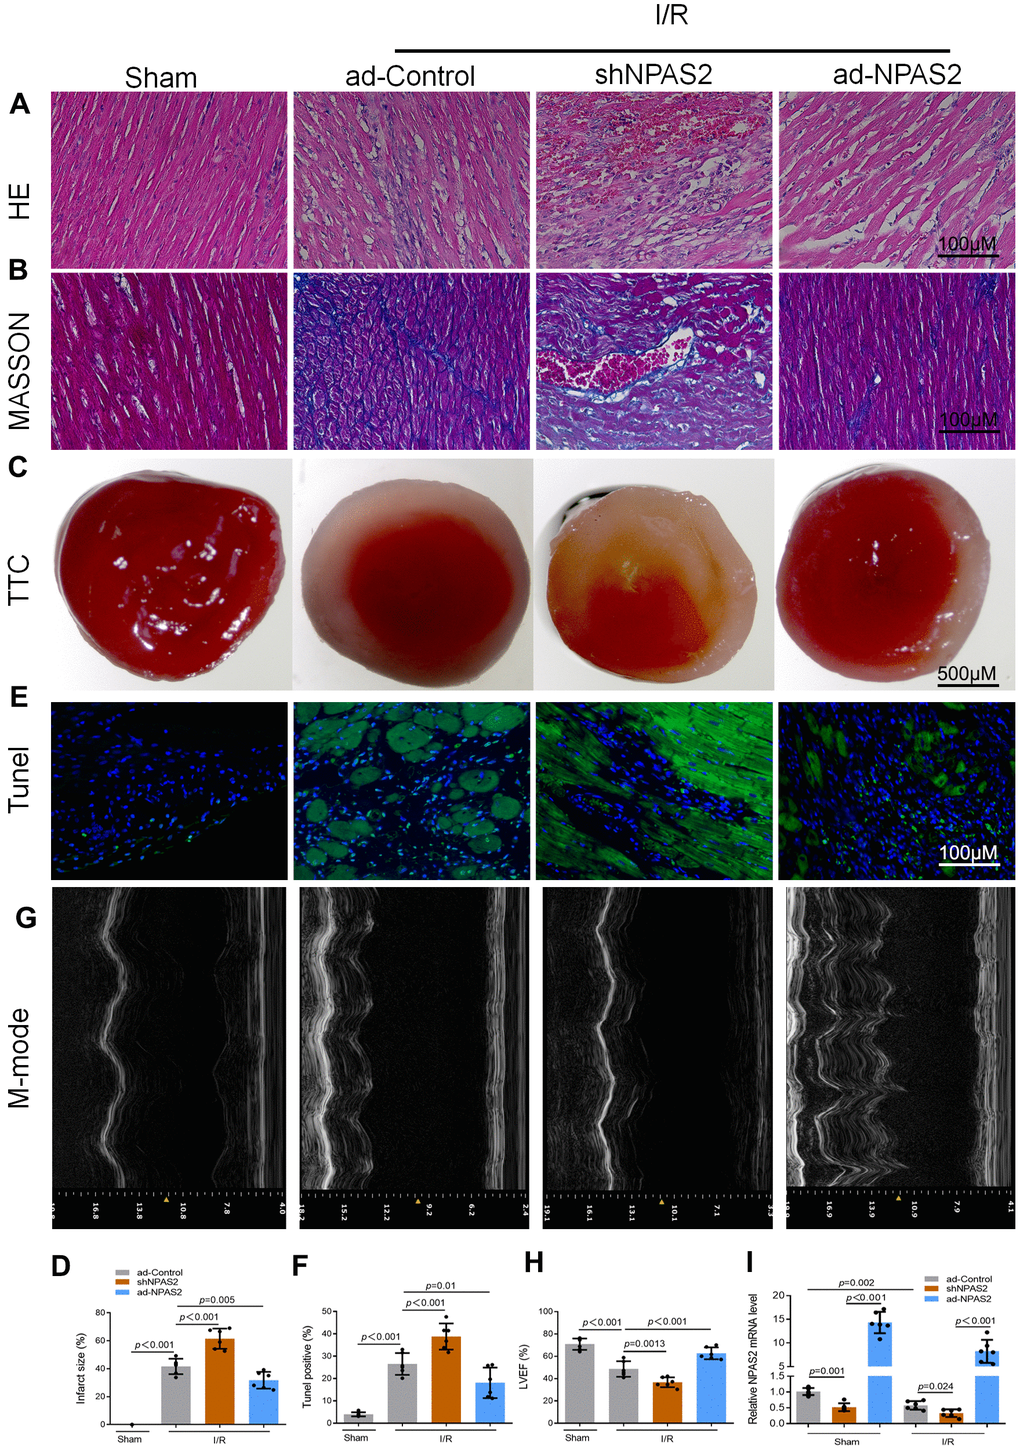
Figure 2.Overexpression of NPAS2 ameliorated rats ischaemia/reperfusion injury in vivo. (A, B) Typical images of H&E and Masson staining of myocardial tissue segments. (C, D) Typical images of TTC of myocardial tissue segments. The infarct size was measured and calculated as a percentage of the total area. (E, F) Typical images of Tunnel of myocardial tissue segments. The relative percentages of apoptotic cells were calculated. (G, H) Typical echocardiographic images of M-mode and LVEF. (I) The mRNA level of NPAS2 in rat myocardial tissue was determined by qRT-PCR. Data are expressed as mean ± SEM (n = 6).