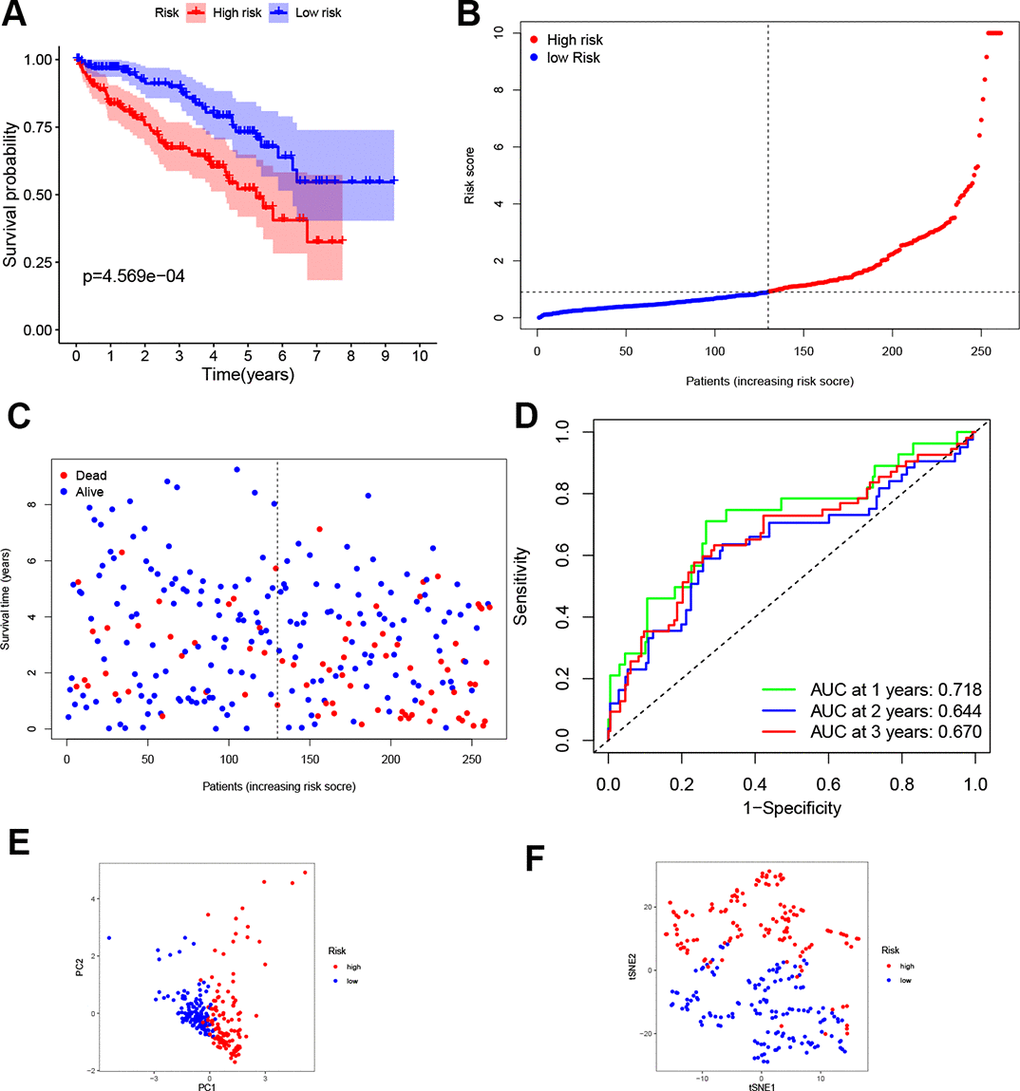
Figure 3.Validation of the four-gene signature. (A) K-M curve for the OS of ccRCC patients in the test set. (B, C) Distribution of the risk scores and corresponding OS status in test set. (D) ROC curve of the prognostic signature in test set. (E, F) PCA and t-SNE analyses of the TCGA test set.