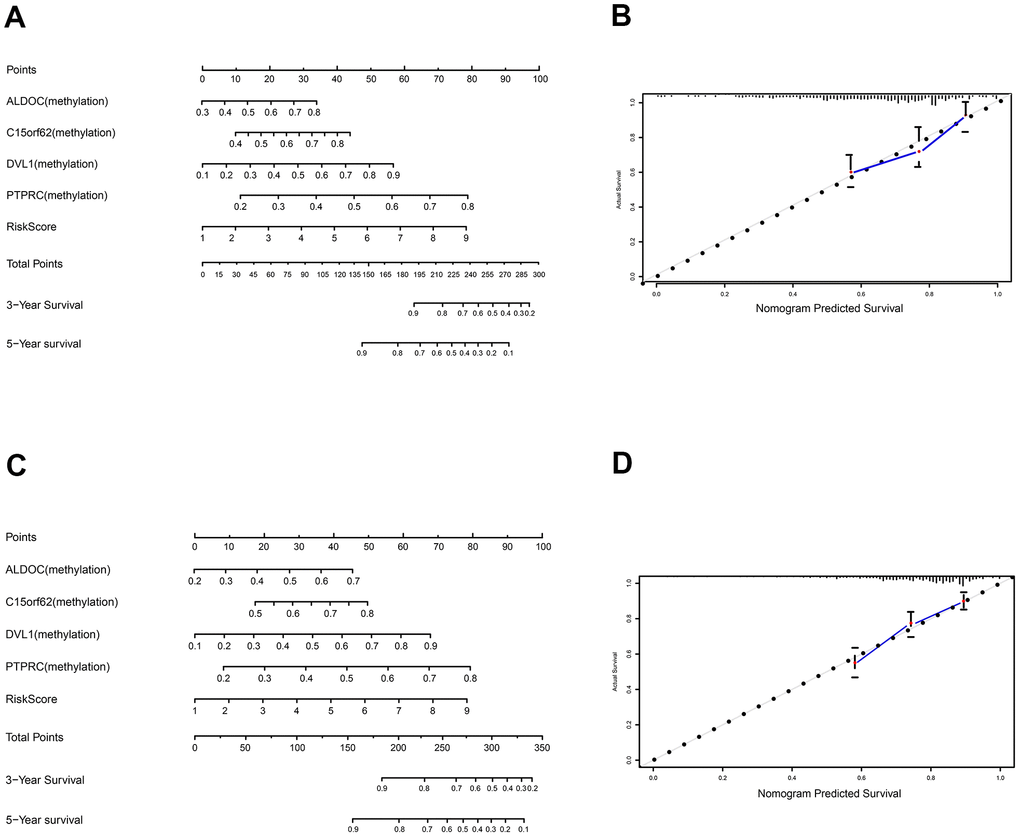
Figure 6.Construction and validation of nomogram. (A) The nomogram for predicting the survival with 3- and 5-year OS. (B) The calibration plot for validation of the model. (C) The nomogram for predicting the survival with 3- and 5-year OS in the validation set. (D) The calibration plot for validation of the model in the validation set.