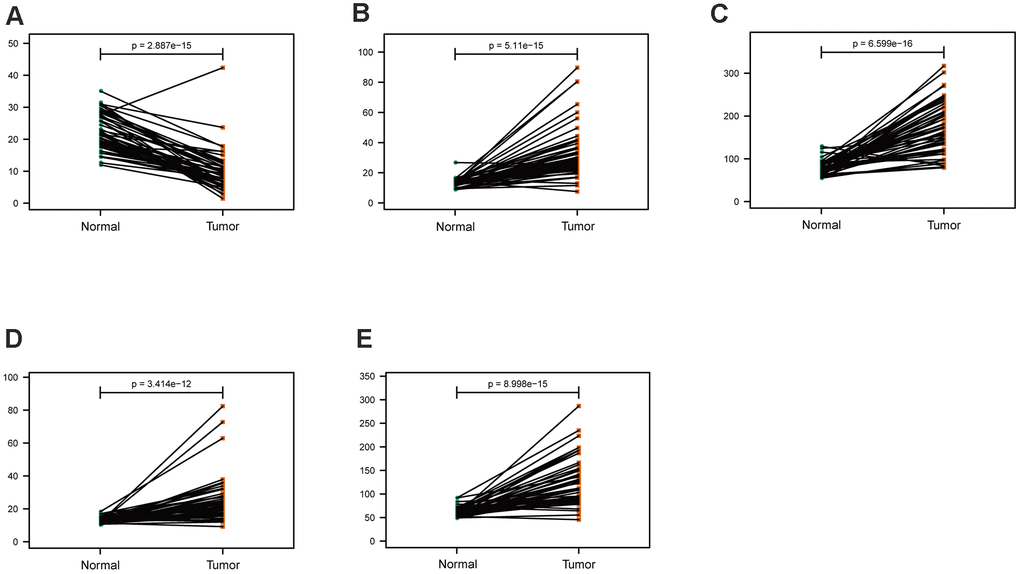
Figure 10.Comparison of the hub genes mRNA levels in paired adjacent normal tissues and LUAD tissues from the TCGA cohort. (A) ARRB1, (B) PARP1, (C) PKM, (D) TFDP1, (E) YWHAZ.
Figure 10 — Development and validation of a novel epigenetic-related prognostic signature and candidate drugs for patients with lung adenocarcinoma | Aging