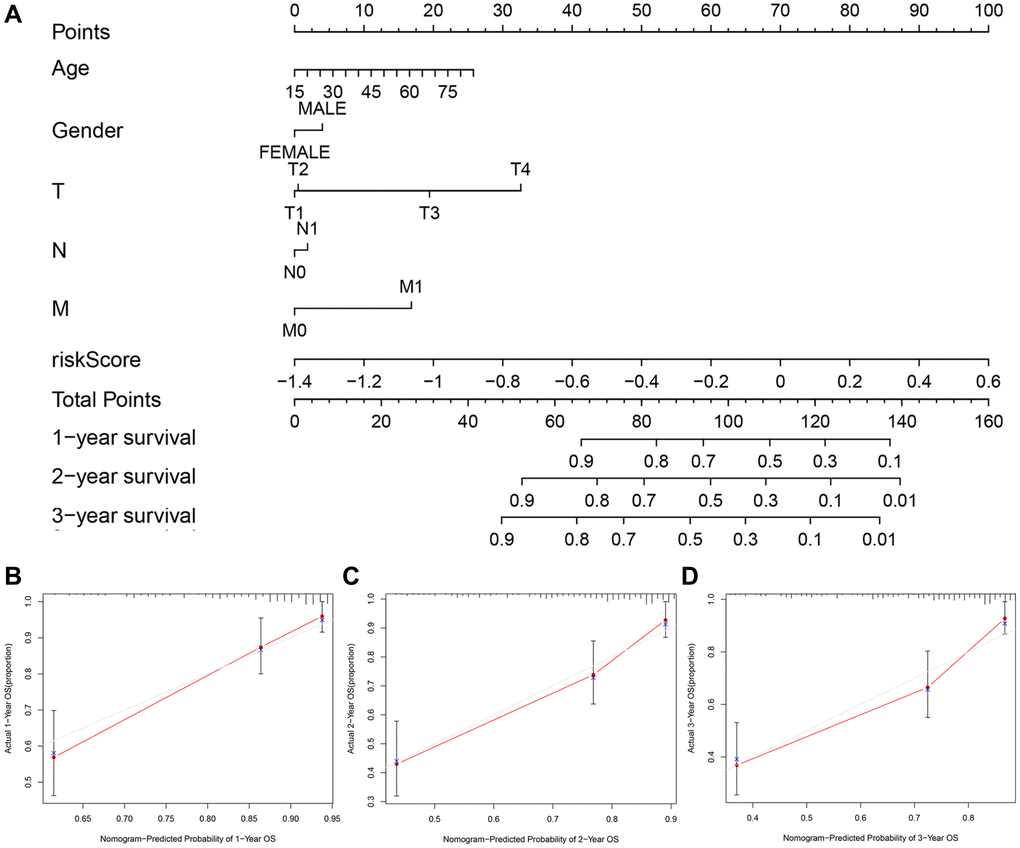
Figure 8.The nomogram to predict the survival probabilities in the TCGA cohort. (A) The nomogram for predicting OS of HCC patients in the TCGA cohort. The calibration plots for predicting 1-year (B), 2-year survival (C) and 3-year survival (D) in the TCGA dataset.