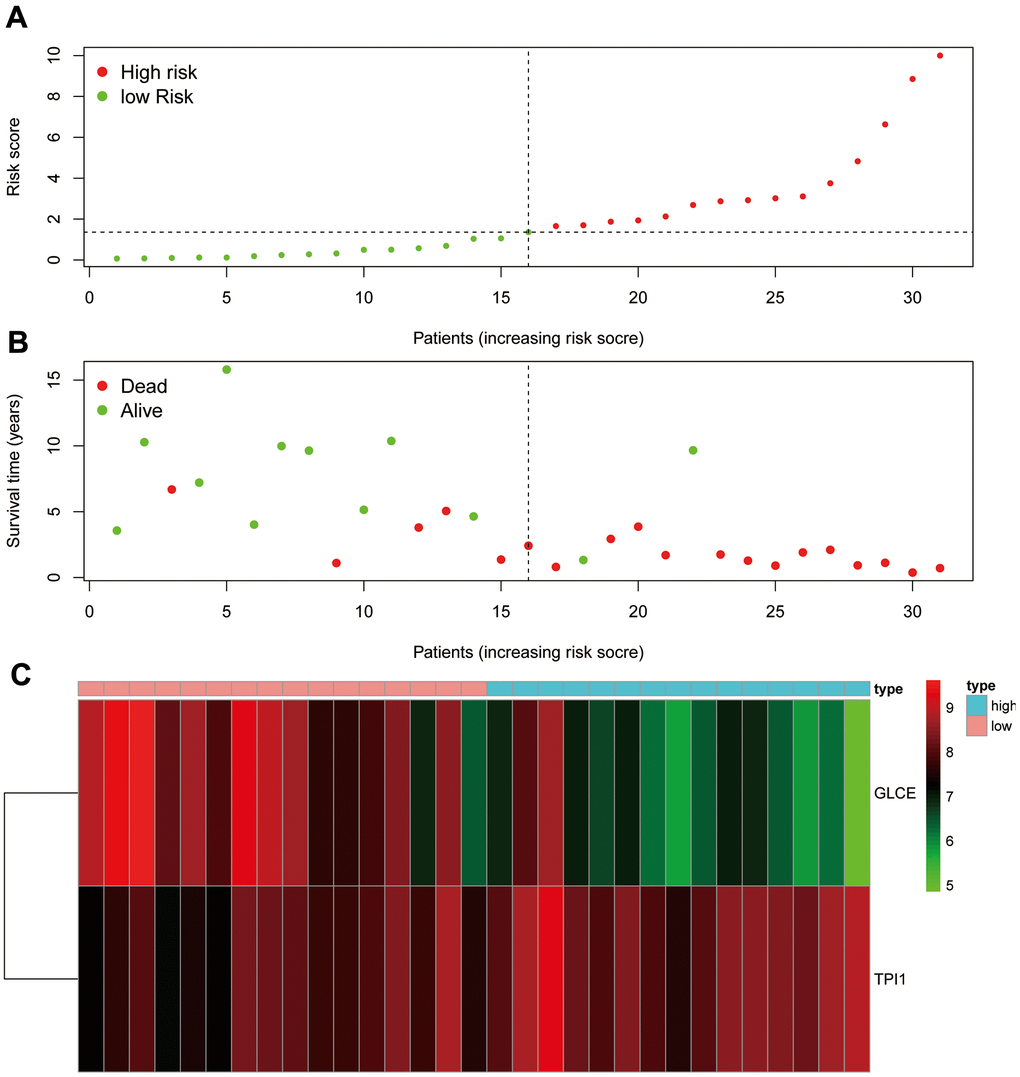
Figure 9.Risk assessment graph. (A) The risk score of the patients; (B) survival and death of the patients, and (C) the expression of the two genes in the high- and low-risk groups.
Figure 9 — Glycolysis- and immune-related novel prognostic biomarkers of Ewing's sarcoma: glucuronic acid epimerase and triosephosphate isomerase 1 | Aging