Submit an Article
Navigate
Home
Editorial Board
Editorial Policies
Current Volume
Archive
Scientific Integrity
Publication Ethics Statements
Interviews with Outstanding Authors
Newsroom
Sponsored Conferences
Podcast
Contact
Special Collections
Submit an Article
Online ISSN: 1945-4589
Research Paper
|
Volume 13, Issue 13
|
pp. 16904–16921
Prognostic and immunological value of
ATP6AP1
in breast cancer: implications for SARS-CoV-2
Back to article
Figure 4
(4 of 7)
−
100%
+
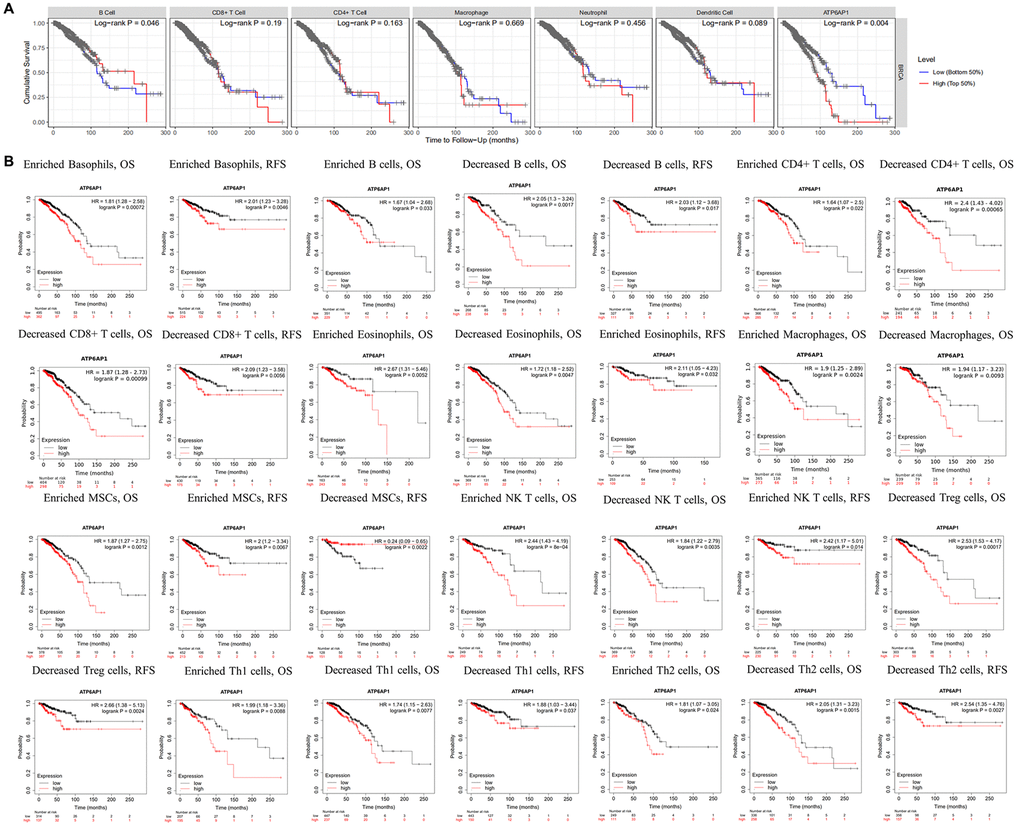
Figure 4.
Survival curves based on
ATP6AP1
levels stratified according to TIIC levels in BC samples from TIMER and Kaplan-Meier Plotter.
(
A
) Data from TIMER (
n
= 1100). (
B
) Data from Kaplan-Meier Plotter.