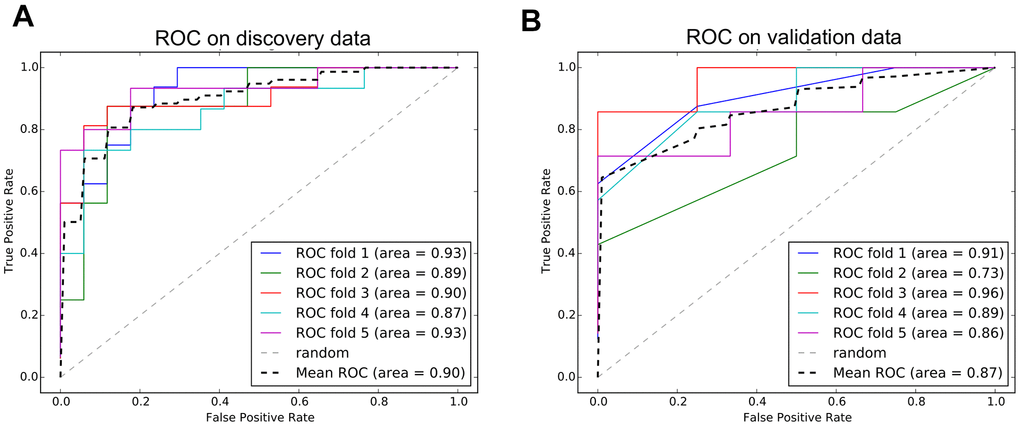
Figure 8.ROC curves of diagnostic model. (A) The performance of model on discovery data from TCGA. (B) The performance of model on validation data from GEO.
Figure 8 — Exhaustive capture of bladder cancer transcriptional and genomic variants integrating canonical and mapping-free protocols | Aging