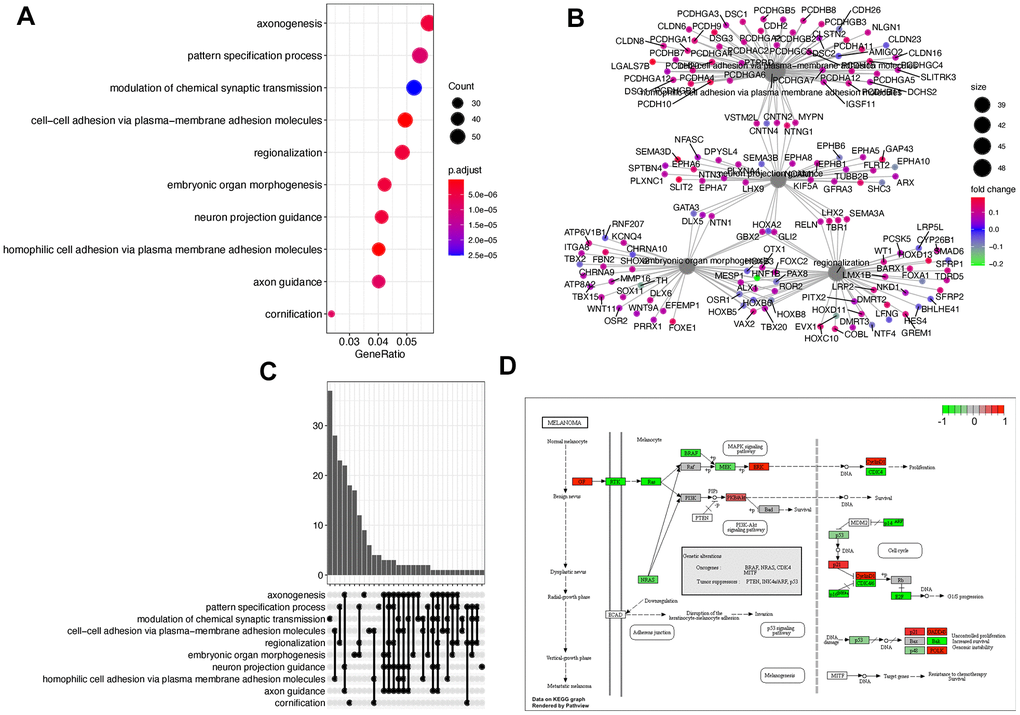
Figure 2.Function enrichment using DEGs. (A) The dotplot of the top 10 enriched gene ontology biological process terms. (B) The regulatory relationships between genes and corresponding functions. (C) The upset graph is showing the number of overlapped genes among functions. (D) The most significant KEGG pathway.