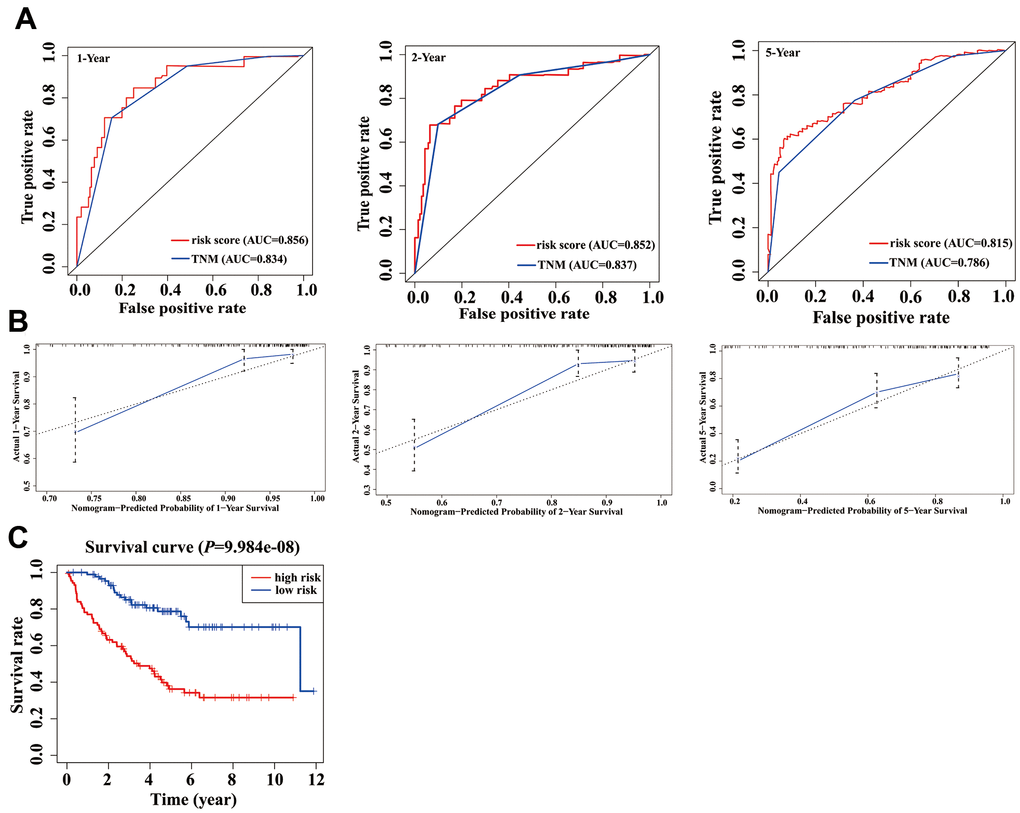
Figure 6.Validation of nomogram in a validation cohort. (A) Shown is the time-dependent ROC curves for 1-, 2-, and 5-year overall survival (OS) predictions from our nomogram compared with TNM stage. (B) Calibration curve for our nomogram in a validation cohort. The predicted and the actual probabilities of OS are plotted using blue solid and black dotted lines, respectively. (C) OS of our nomogram in a validation cohort.