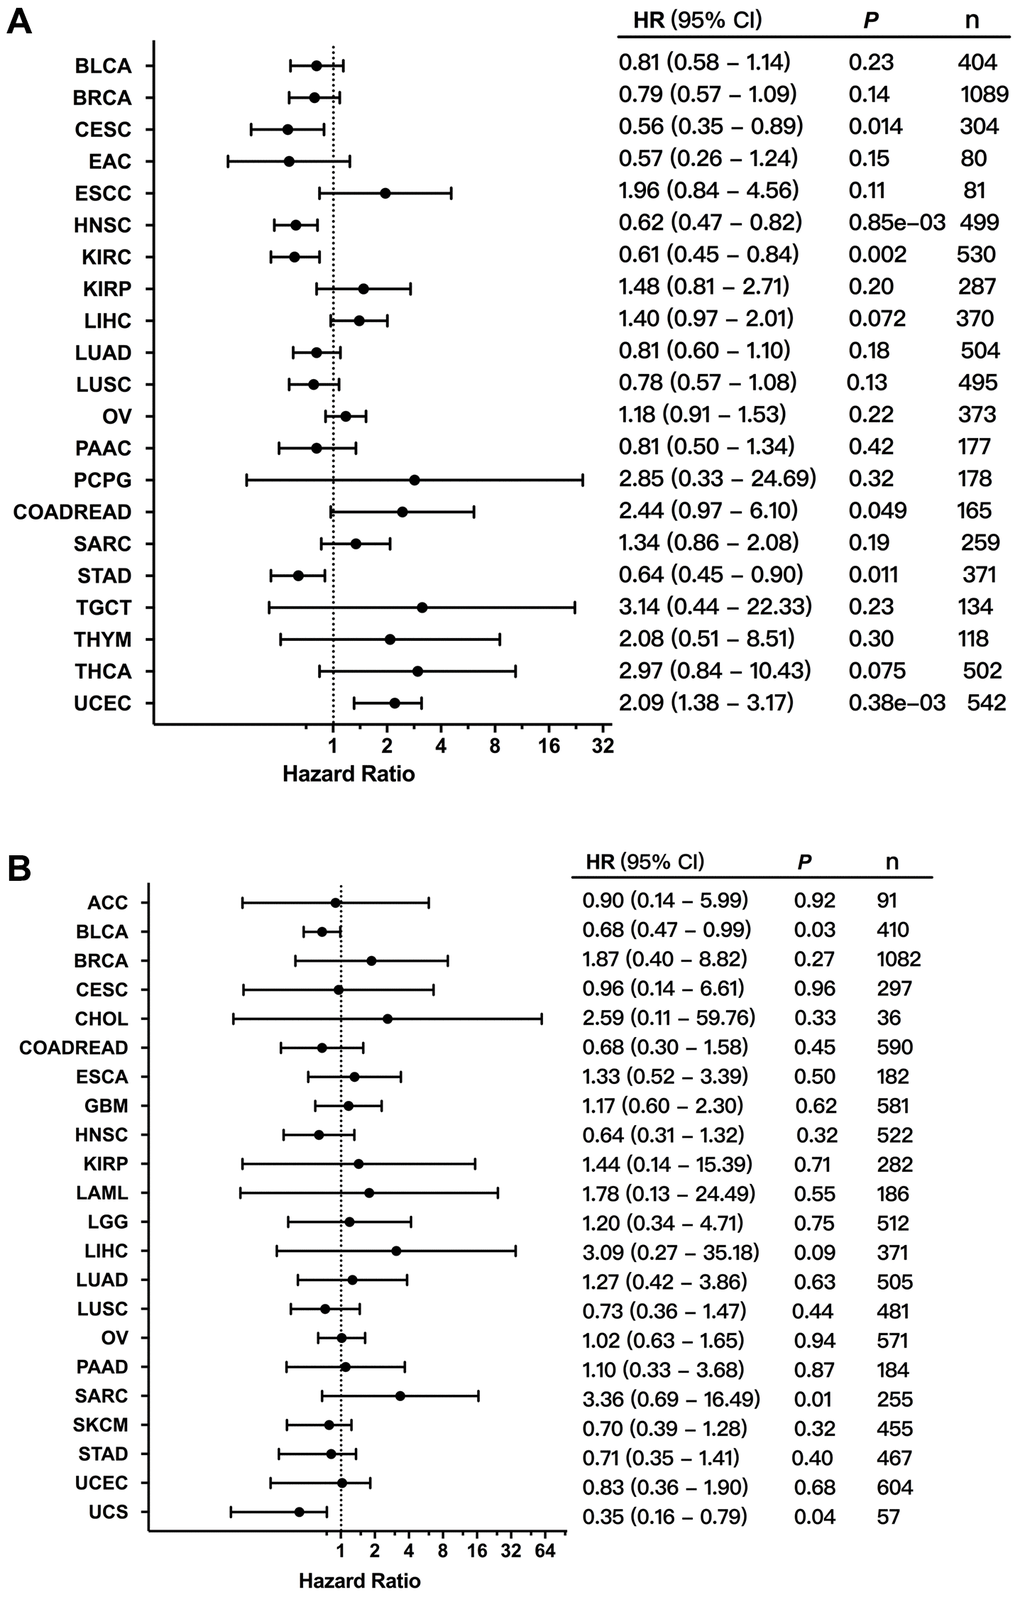
Figure 8.Correlation between the expression and alterations of FGFR3 and patient survival. (A) The correlation between FGFR3 expression and overall survival (OS) as exhibited in forest plot based on Kaplan-Meier Plotter. (B) The correlation between FGFR3 alterations and OS as exhibited in forest plot based on cBioPortal.