Submit an Article
Navigate
Home
Editorial Board
Editorial Policies
Current Volume
Archive
Scientific Integrity
Publication Ethics Statements
Interviews with Outstanding Authors
Newsroom
Sponsored Conferences
Podcast
Contact
Special Collections
Submit an Article
Online ISSN: 1945-4589
Research Paper
|
Volume 13, Issue 12
|
pp. 16445–16470
Identification and validation of inferior prognostic genes associated with immune signatures and chemotherapy outcome in acute myeloid leukemia
Back to article
Figure 11
(11 of 13)
−
100%
+
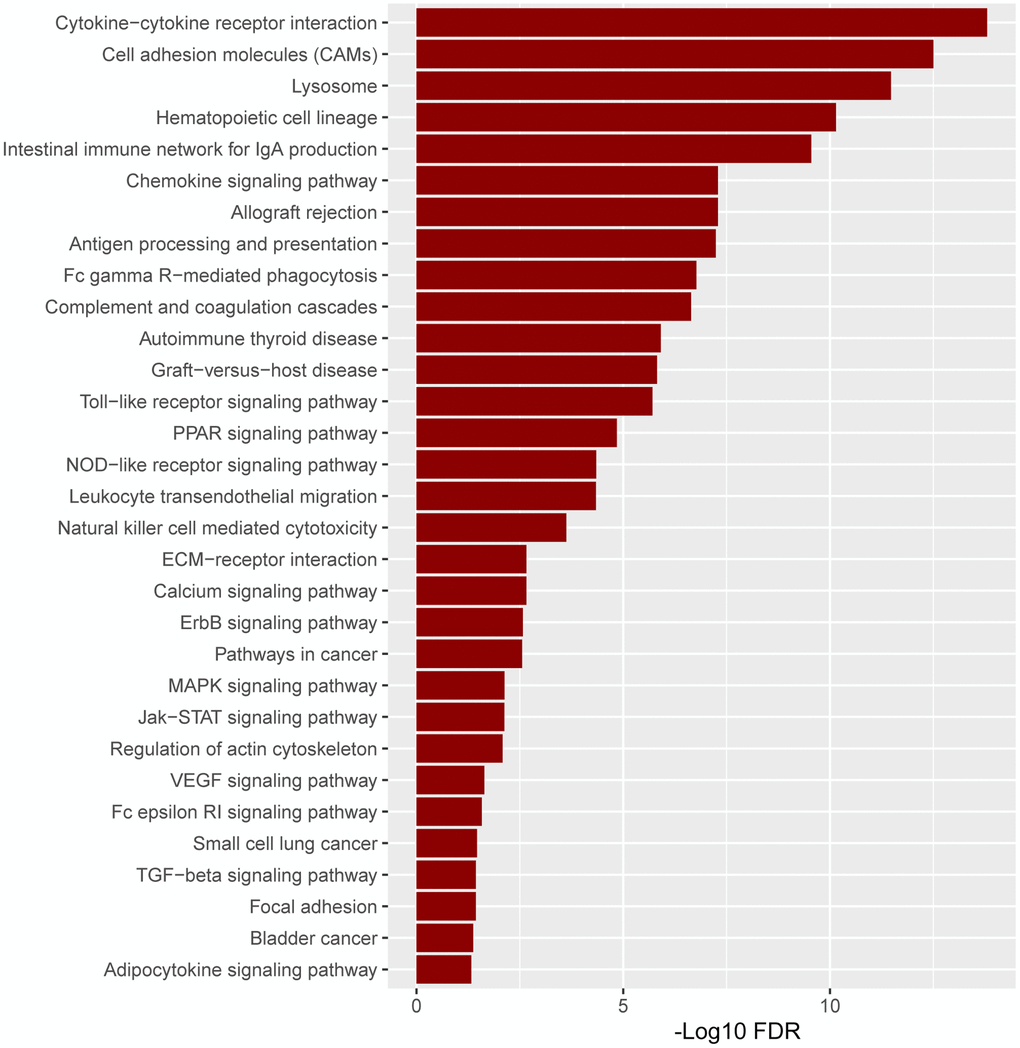
Figure 11.
The pathway enrichment in the high versus low
ITGAM
expression group is based on the TCGA-LAML expression profiles.
The significant enriched KEGG pathways were confirmed as an enrichment when FDR < 0.05.