Submit an Article
Navigate
Home
Editorial Board
Editorial Policies
Current Volume
Archive
Scientific Integrity
Publication Ethics Statements
Interviews with Outstanding Authors
Newsroom
Sponsored Conferences
Podcast
Contact
Special Collections
Submit an Article
Online ISSN: 1945-4589
Research Paper
|
Volume 13, Issue 11
|
pp. 15400–15412
Longitudinal trajectories of metabolic syndrome on different neurocognitive domains: a cohort study from the Taiwan biobank
Back to article
Figure 1
(1 of 2)
−
100%
+
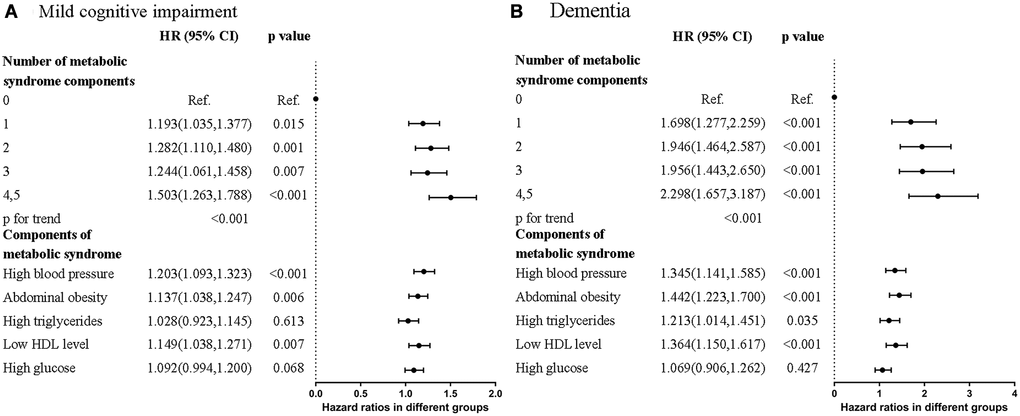
Figure 1.
Forest plots that showed hazard ratios of (
A
) Mild cognitive impairment (MCI) (
B
) Dementia in different numbers and contents of metabolic syndrome components.