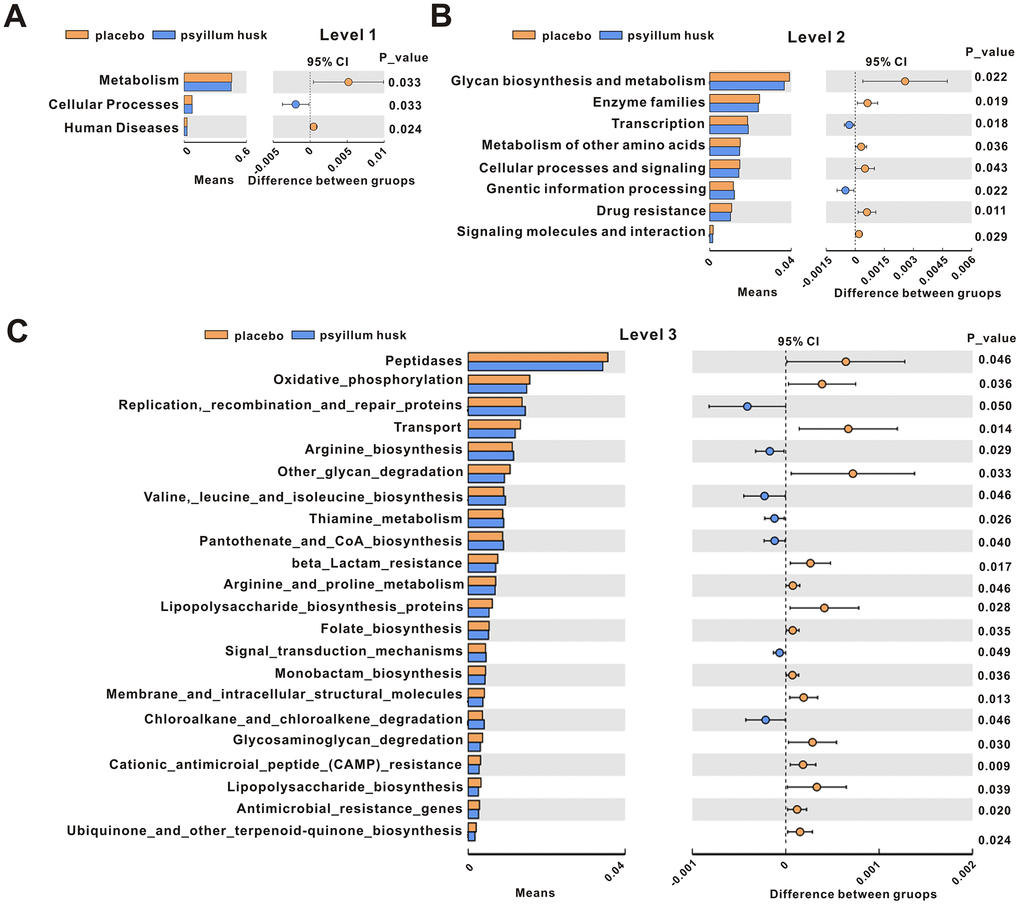
Figure 7.KEGG signaling pathways were compared between the placebo and psyllium husk groups at levels 1 (A), 2 (B), and 3 (C), as analyzed by Student’s t test (P < 0.05). CI: confidence interval.
Figure 7 — The effects of psyllium husk on gut microbiota composition and function in chronically constipated women of reproductive age using 16S rRNA gene sequencing analysis | Aging