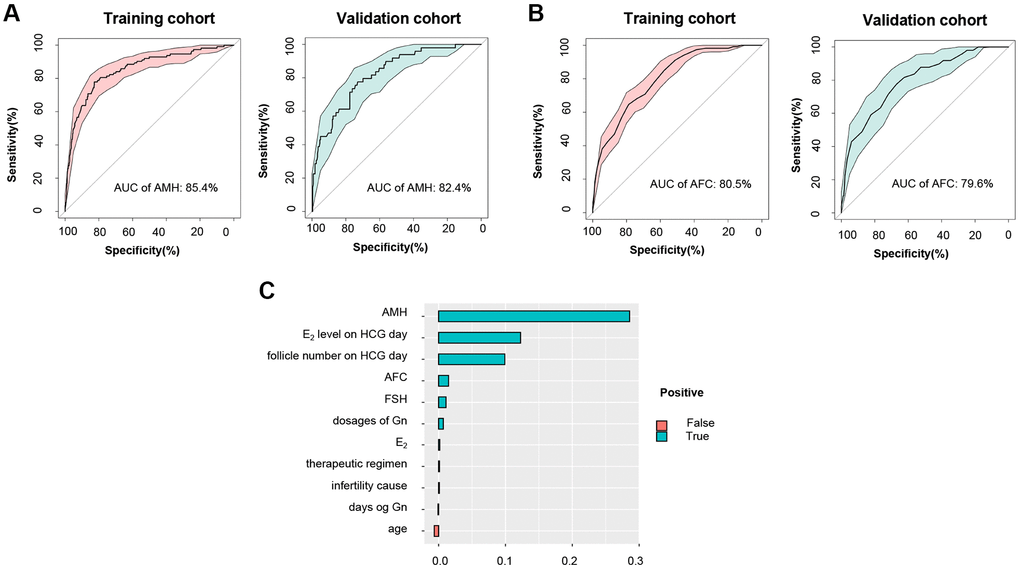
Figure 4.Comparison between HPTM and common clinical characteristics. (A) ROC curve and the corresponding AUC of AMH for training and validation cohort. (B) ROC curve and the corresponding AUC of AFC for training and validation cohort. (C) Variable importance ranking in HPTM.