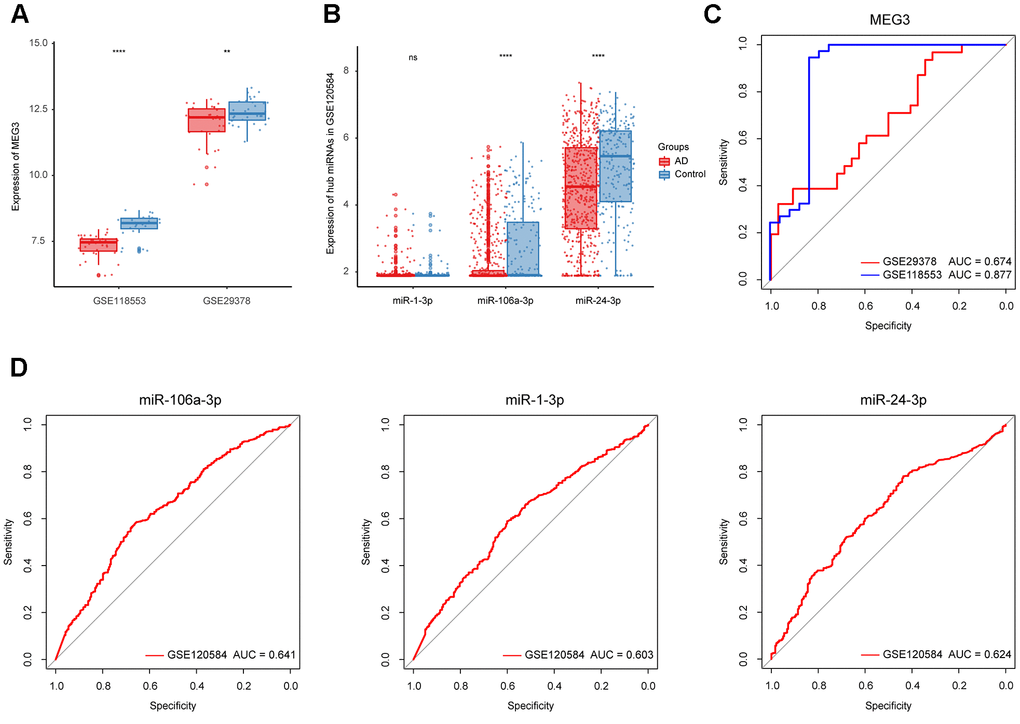
Figure 5.Identification of the refined hub ncRNAs. (A) Expression of MEG3 in GSE118553 and GSE29378. (B) Expression of hub miRNAs in GSE120584. (C) ROC analysis of MEG3 in GSE118553 and GSE29378. (D) ROC analysis of the hub miRNAs in GSE120584. Data were presented as the mean ± SD in each group. ns, p > 0.05, ** p < 0.01 and **** p < 0.0001.