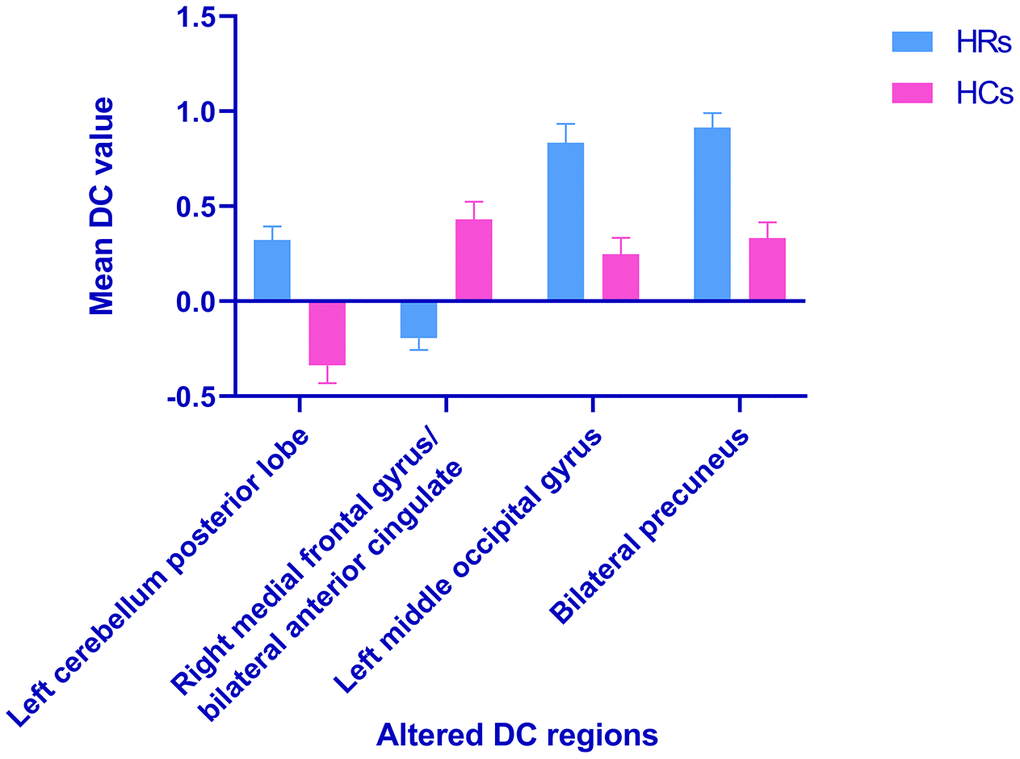
Figure 3.Voxel-wise comparison of DC in the HR and healthy control group. Notes: The mean DC values between the HR and HC groups. Abbreviations: DC, degree centrality; HRs, hypertensive retinopathy; HCs, healthy controls.
Figure 3 — Spontaneous functional changes in specific cerebral regions in patients with hypertensive retinopathy: a resting-state functional magnetic resonance imaging study | Aging