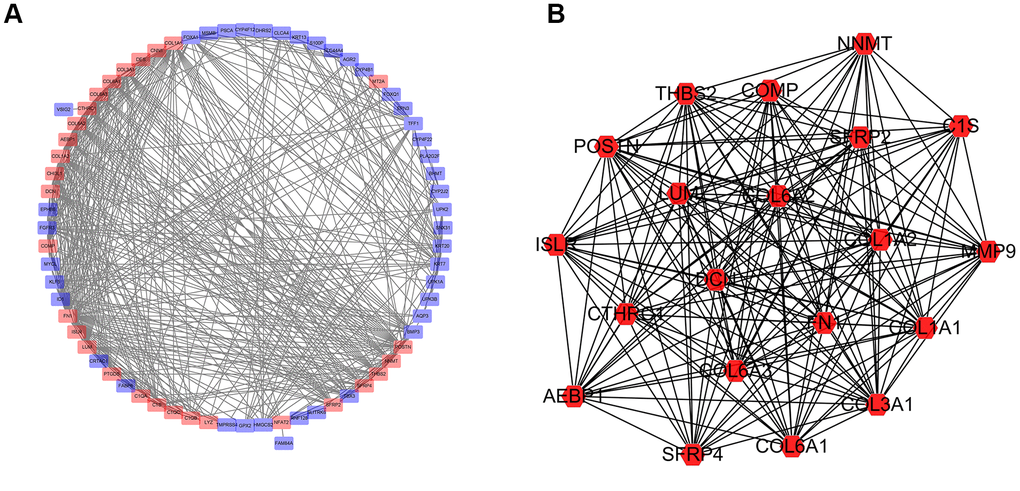
Figure 9.Network of protein-protein interactions (PPI) analysis. (A) Protein-protein interaction network was constructed for the DEGs using Cytoscape. (B) Subnetwork with the highest score using MCODE tool.
Figure 9 — Prognostic value of members of NFAT family for pan-cancer and a prediction model based on NFAT2 in bladder cancer | Aging