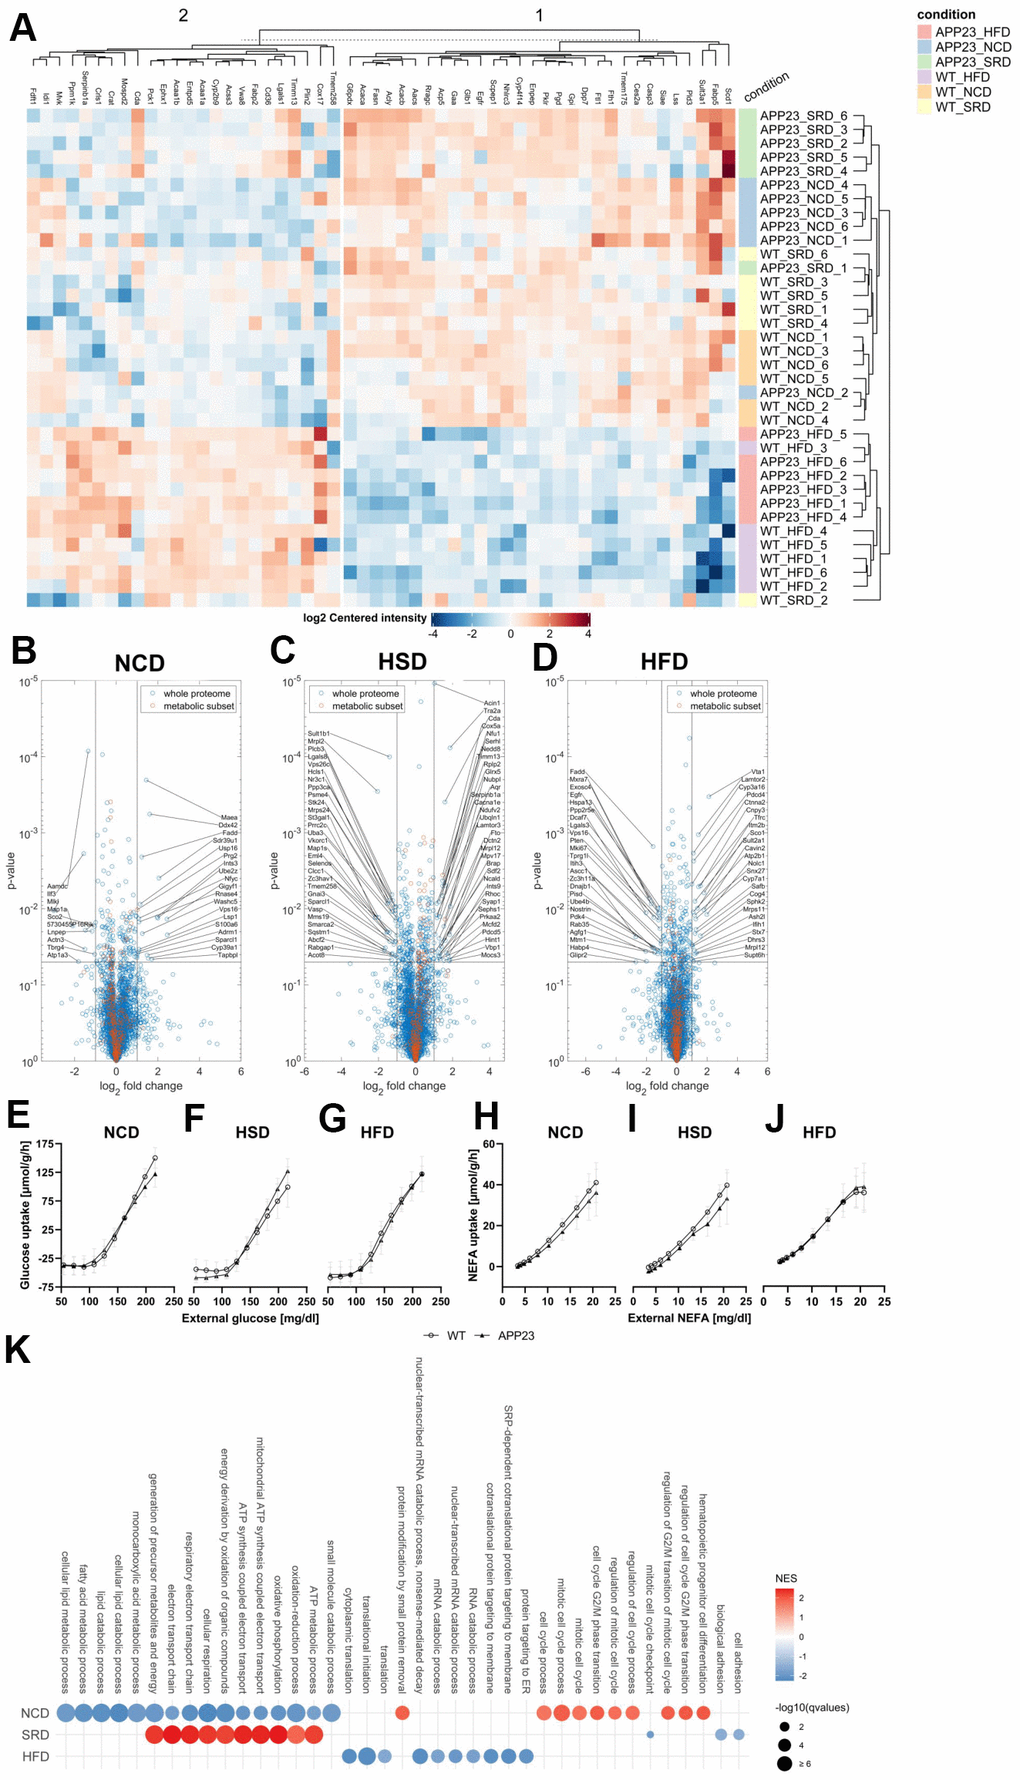
Figure 7.Proteome analyses of liver tissue. (A) Heatmap of differentially regulated proteins (B–D) Volcano plots of APP23 versus WT mice within each diet. (E–G) Simulated hepatic glucose tolerance of APP23 versus WT mice within each diet. (H–J) Simulated hepatic NEFA tolerance of APP23 versus WT mice within each diet. (K) GSEA of APP23 versus WT mice within each diet. (B, E, H) NCD; (C, F, I) HSD; (D, G, J) HFD. n=6 each.