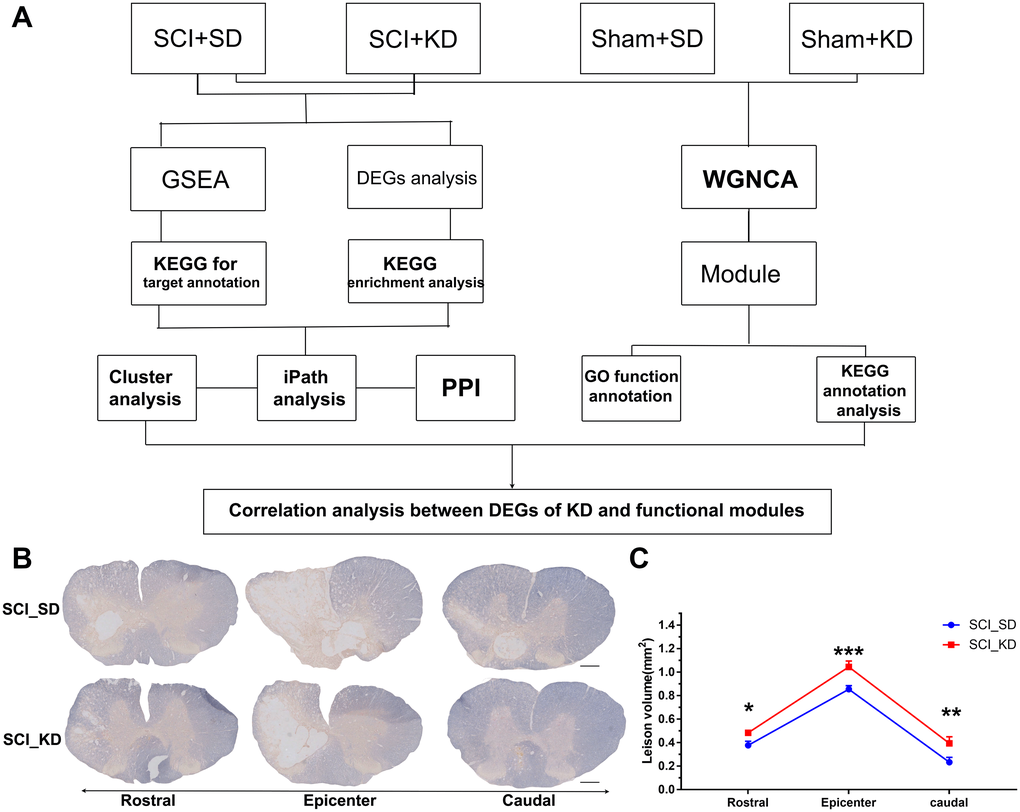
Figure 1.Experimental protocol and animal myelin area. (A) Detailed experimental protocol. (B) Representative images showing EC staining after SCI. Scale bar = 1 mm. (C) Quantitative analysis of the results in panel (A). All data are presented as the mean ± standard deviation, n = 3. Rostral of the injury site, p = 0.0255; Epicentre, p = 0.0004; Caudal, p = 0.0015.