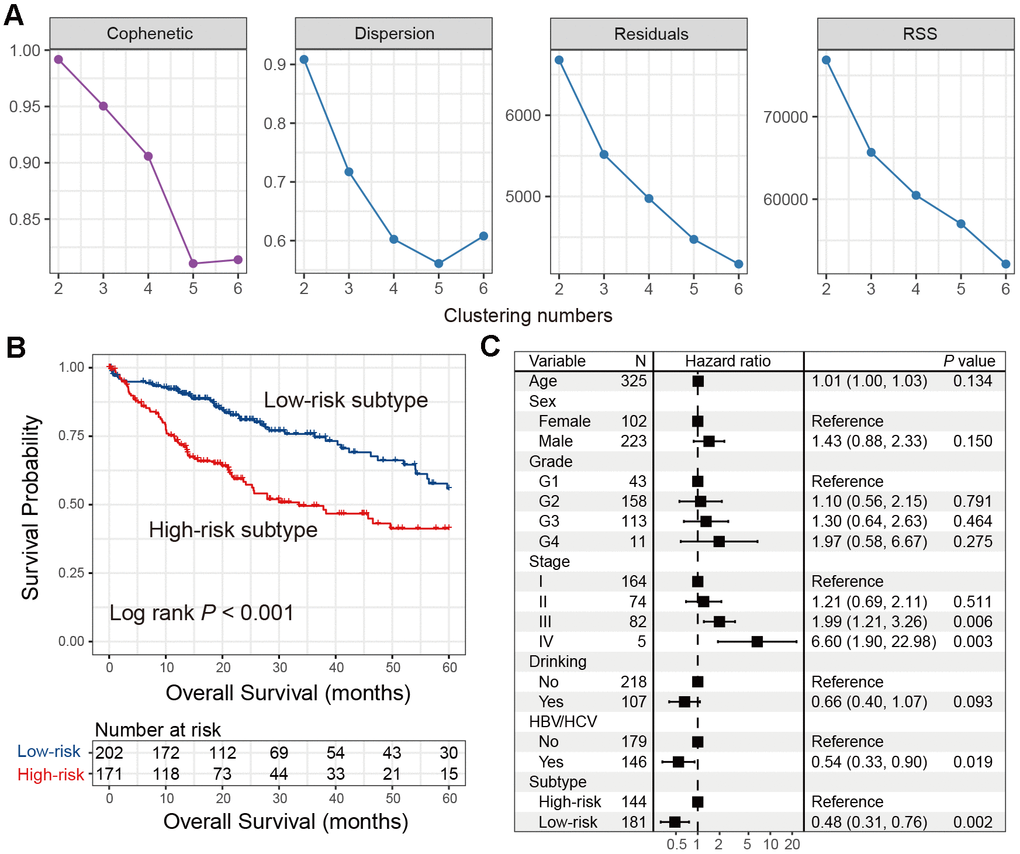
Figure 2.Identification of the immune low-risk subtype of HCC in TCGA. (A) Associations between NMF coefficients and clustering numbers. (B) Kaplan-Meier survival analysis of identified low-risk and high-risk subtypes. (C) Forest plot of multivariate Cox regression model with HCC clinical factors taken into account.