Submit an Article
Navigate
Home
Editorial Board
Editorial Policies
Current Volume
Archive
Scientific Integrity
Publication Ethics Statements
Interviews with Outstanding Authors
Newsroom
Sponsored Conferences
Podcast
Contact
Special Collections
Submit an Article
Online ISSN: 1945-4589
Research Paper
|
Volume 13, Issue 9
|
pp. 12748–12765
The different hypoglycemic effects between East Asian and non-Asian type 2 diabetes patients when treated with SGLT-2 inhibitors as an add-on treatment for metformin: a systematic review and meta-analysis of randomized controlled trials
Back to article
Figure 3B
(4 of 8)
−
100%
+
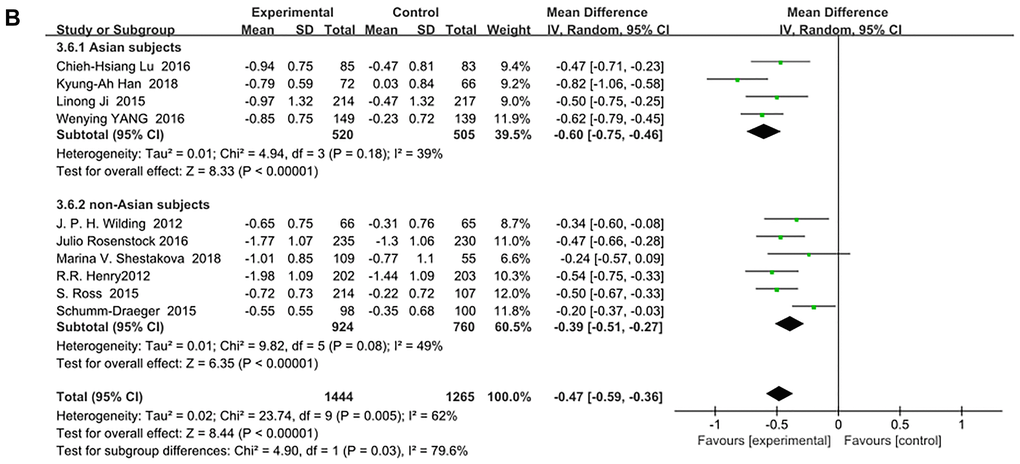
Figure 3B.
Forest plot of the weighted mean difference in the change of HbA1c from baseline. (sensitivity analysis).