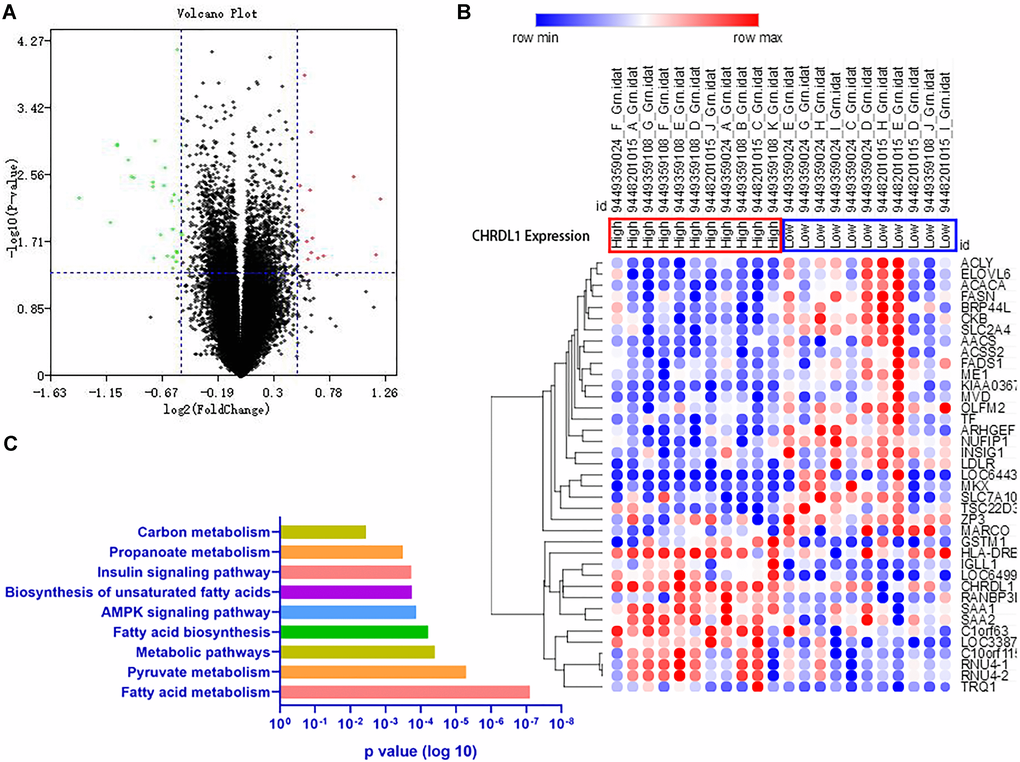
Figure 4.Associations between genome-wide expression profiles and CHRDL1 expression. (A) The Volcano plots of the gene expression when divided the PCOS cases into two groups according to the CHRDL1 expression. (B) The heatmap of the DEGs. (C) The KEGG Pathway enrichment analysis of the DEGs.